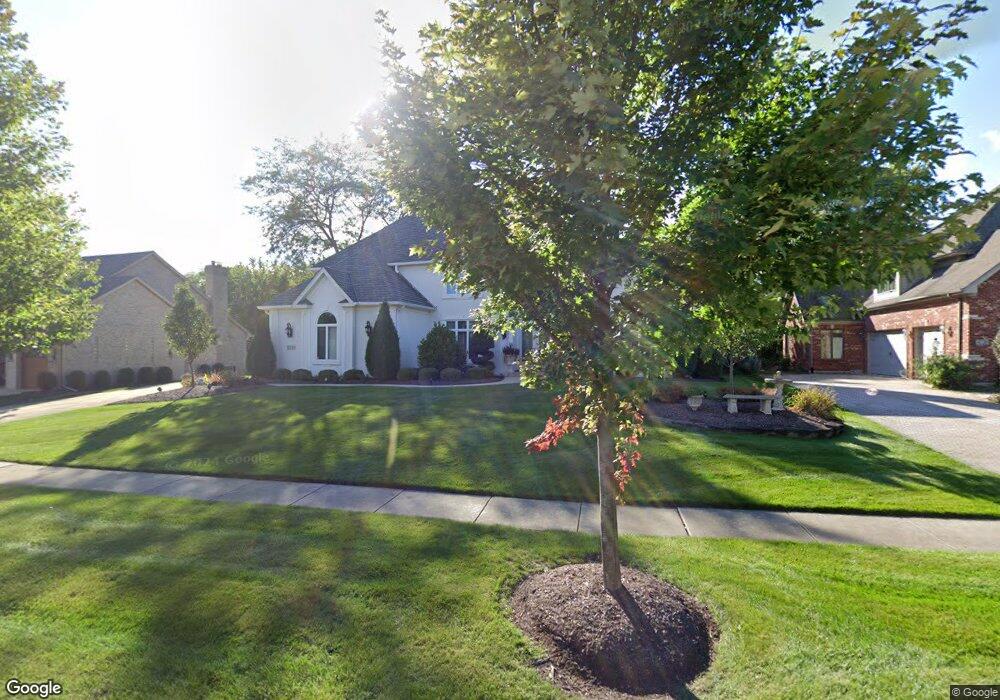
6714 Sweetbriar Ln Darien, IL 60561
Estimated Value: $754,374 - $932,000
--
Bed
--
Bath
2,959
Sq Ft
$284/Sq Ft
Est. Value
About This Home
This home is located at 6714 Sweetbriar Ln, Darien, IL 60561 and is currently estimated at $839,844, approximately $283 per square foot. 6714 Sweetbriar Ln is a home located in DuPage County with nearby schools including Mark Delay School, Lace Elementary School, and Eisenhower Jr High School.
Ownership History
Date
Name
Owned For
Owner Type
Purchase Details
Closed on
Jan 16, 2012
Sold by
Topel Kathie and Topel Kathie A Hemp
Bought by
Topel Kathie and Kathie Topel Trust
Current Estimated Value
Purchase Details
Closed on
Aug 13, 2009
Sold by
Topel William F
Bought by
Topel Kathie A Hemp
Home Financials for this Owner
Home Financials are based on the most recent Mortgage that was taken out on this home.
Original Mortgage
$250,000
Outstanding Balance
$162,835
Interest Rate
5.19%
Mortgage Type
New Conventional
Estimated Equity
$677,009
Purchase Details
Closed on
Jun 8, 1995
Sold by
Caruso D A and Caruso Rachelle J
Bought by
Topel William F and Topel Kathie A Hemp
Purchase Details
Closed on
Sep 27, 1994
Sold by
Caruso D A
Bought by
Topel William F and Topel Kathie Hemp
Purchase Details
Closed on
Aug 22, 1994
Sold by
American National Bk & Tr Co Of Chicago
Bought by
Caruso D A
Create a Home Valuation Report for This Property
The Home Valuation Report is an in-depth analysis detailing your home's value as well as a comparison with similar homes in the area
Home Values in the Area
Average Home Value in this Area
Purchase History
| Date | Buyer | Sale Price | Title Company |
|---|---|---|---|
| Topel Kathie | -- | Chicago Title Insurance Co | |
| Topel Kathie A Hemp | -- | Citywide Title Corporation | |
| Topel William F | $437,500 | -- | |
| Topel William F | -- | -- | |
| Caruso D A | $119,500 | -- |
Source: Public Records
Mortgage History
| Date | Status | Borrower | Loan Amount |
|---|---|---|---|
| Open | Topel Kathie A Hemp | $250,000 |
Source: Public Records
Tax History Compared to Growth
Tax History
| Year | Tax Paid | Tax Assessment Tax Assessment Total Assessment is a certain percentage of the fair market value that is determined by local assessors to be the total taxable value of land and additions on the property. | Land | Improvement |
|---|---|---|---|---|
| 2024 | $14,101 | $218,920 | $95,302 | $123,618 |
| 2023 | $13,568 | $201,250 | $87,610 | $113,640 |
| 2022 | $13,840 | $205,160 | $89,310 | $115,850 |
| 2021 | $13,379 | $202,820 | $88,290 | $114,530 |
| 2020 | $13,173 | $198,800 | $86,540 | $112,260 |
| 2019 | $12,748 | $190,750 | $83,040 | $107,710 |
| 2018 | $12,273 | $179,320 | $82,490 | $96,830 |
| 2017 | $11,955 | $172,560 | $79,380 | $93,180 |
| 2016 | $11,705 | $164,690 | $75,760 | $88,930 |
| 2015 | $13,158 | $175,870 | $71,280 | $104,590 |
| 2014 | $13,414 | $176,340 | $69,300 | $107,040 |
| 2013 | $13,001 | $175,520 | $68,980 | $106,540 |
Source: Public Records
Map
Nearby Homes
- 6722 Sweetbriar Ln
- 1813 Kelly Ct
- 1408 Spruce Ln
- 1409 S Williams St
- 1208 Connamara Ct
- 1301 S Williams St Unit 2
- 1209 W Charles Ln
- 714 W 63rd St Unit 202
- 6901 Meadowcrest Dr
- 419 63rd St
- 824 Oxford St
- 400 74th St Unit 106
- 7303 Grand Ave Unit 102
- 521 73rd St Unit 105
- 61 Pier Dr Unit 202
- 1327 Cass Ln E Unit 301
- 107 65th Lake Dr Unit 202
- 55 W 64th St Unit 202
- 55 W 64th St Unit 102
- 7318 Winthrop Way Unit 4
- 6710 Sweetbriar Ln
- 6718 Sweetbriar Ln
- 1822 Kelly Ct
- 6713 Dicosola Ct
- 6717 Dicosola Ct
- 6706 Sweetbriar Ln
- 6713 Sweetbriar Ln
- 6709 Sweetbriar Ln Unit 5
- 6726 Sweetbriar Ln
- 6705 Sweetbriar Ln
- 1818 Kelly Ct
- 6701 Dicosola Ct
- 1821 Kelly Ct
- 1817 Kelly Ct
- 6701 Sweetbriar Ln
- 1902 Sweetbriar Ln Unit 5
- 1906 Sweetbriar Ln
- 6718 Dicosola Ct
- 6714 Dicosola Ct
- 6710 Dicosola Ct