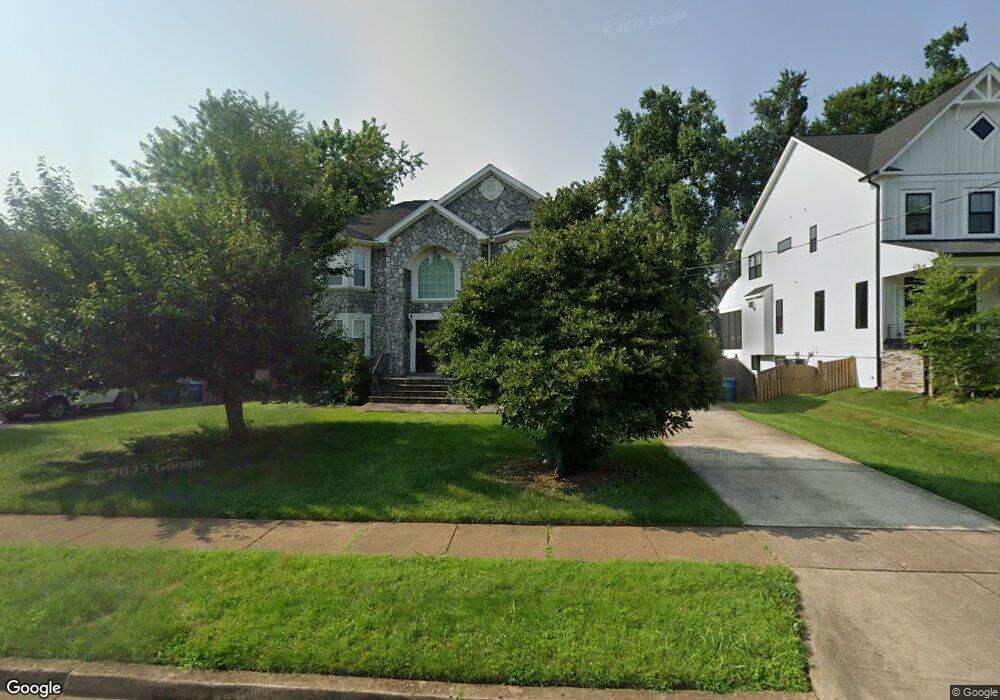
6715 Dean Dr McLean, VA 22101
Estimated Value: $1,483,367 - $1,787,000
6
Beds
5
Baths
4,000
Sq Ft
$406/Sq Ft
Est. Value
About This Home
This home is located at 6715 Dean Dr, McLean, VA 22101 and is currently estimated at $1,622,592, approximately $405 per square foot. 6715 Dean Dr is a home located in Fairfax County with nearby schools including Kent Gardens Elementary School, Longfellow Middle School, and McLean High School.
Ownership History
Date
Name
Owned For
Owner Type
Purchase Details
Closed on
Jan 29, 2009
Sold by
Revollo Jose E
Bought by
Zhang Jiqiang and Zheng,Xiaowei
Current Estimated Value
Home Financials for this Owner
Home Financials are based on the most recent Mortgage that was taken out on this home.
Original Mortgage
$625,000
Outstanding Balance
$398,445
Interest Rate
5.26%
Mortgage Type
New Conventional
Estimated Equity
$1,224,147
Purchase Details
Closed on
Dec 12, 2006
Sold by
Sullivan Kevin A
Bought by
Revollo Jose E
Home Financials for this Owner
Home Financials are based on the most recent Mortgage that was taken out on this home.
Original Mortgage
$488,000
Interest Rate
6.31%
Mortgage Type
New Conventional
Purchase Details
Closed on
May 28, 2004
Sold by
Sikora John J
Bought by
Sullivan Kevin A and Bullington',Margaret P
Home Financials for this Owner
Home Financials are based on the most recent Mortgage that was taken out on this home.
Original Mortgage
$33,700
Interest Rate
5.88%
Mortgage Type
New Conventional
Create a Home Valuation Report for This Property
The Home Valuation Report is an in-depth analysis detailing your home's value as well as a comparison with similar homes in the area
Home Values in the Area
Average Home Value in this Area
Purchase History
| Date | Buyer | Sale Price | Title Company |
|---|---|---|---|
| Zhang Jiqiang | $915,000 | -- | |
| Revollo Jose E | $610,000 | -- | |
| Sullivan Kevin A | $450,000 | -- |
Source: Public Records
Mortgage History
| Date | Status | Borrower | Loan Amount |
|---|---|---|---|
| Open | Zhang Jiqiang | $625,000 | |
| Previous Owner | Revollo Jose E | $488,000 | |
| Previous Owner | Sullivan Kevin A | $33,700 |
Source: Public Records
Tax History
| Year | Tax Paid | Tax Assessment Tax Assessment Total Assessment is a certain percentage of the fair market value that is determined by local assessors to be the total taxable value of land and additions on the property. | Land | Improvement |
|---|---|---|---|---|
| 2025 | $15,204 | $1,367,130 | $545,000 | $822,130 |
| 2024 | $15,204 | $1,286,810 | $495,000 | $791,810 |
| 2023 | $13,634 | $1,184,060 | $495,000 | $689,060 |
| 2022 | $12,560 | $1,076,740 | $440,000 | $636,740 |
| 2021 | $11,324 | $946,450 | $408,000 | $538,450 |
| 2020 | $11,297 | $936,370 | $408,000 | $528,370 |
| 2019 | $11,196 | $927,960 | $408,000 | $519,960 |
| 2018 | $10,520 | $914,810 | $400,000 | $514,810 |
| 2017 | $10,287 | $868,840 | $396,000 | $472,840 |
| 2016 | $10,055 | $851,070 | $392,000 | $459,070 |
Source: Public Records
Map
Nearby Homes
- 6816 Dean Dr
- 1707 Westmoreland St
- 1715 Maxwell Ct
- 1713 Rupert St
- 1712 Dalewood Place
- 1710 Dalewood Place
- 6539 Fairlawn Dr
- 6935 Southridge Dr
- 7000 Tyndale St
- 1935 Foxhall Rd
- 6526 Dryden Dr
- 1904 Lamson Place
- 6514 Byrnes Dr
- 1601 Wrightson Dr
- 1573 Westmoreland St
- 1955 Kirby Rd
- 1623 Dempsey St
- 1730 Barbee St
- 1566B Westmoreland St
- 6501 Divine St
Your Personal Tour Guide
Ask me questions while you tour the home.