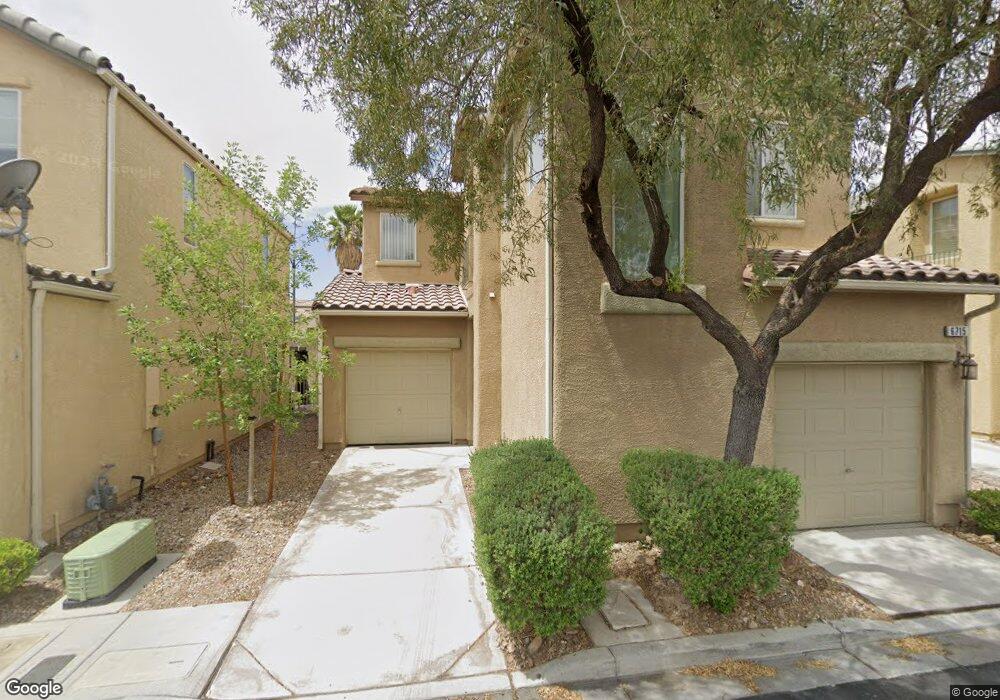
6715 Moreno Valley St Unit none Las Vegas, NV 89149
Centennial Hills Town Center NeighborhoodEstimated Value: $337,549
3
Beds
3
Baths
1,190
Sq Ft
$284/Sq Ft
Est. Value
About This Home
This home is located at 6715 Moreno Valley St Unit none, Las Vegas, NV 89149 and is currently priced at $337,549, approximately $283 per square foot. 6715 Moreno Valley St Unit none is a home located in Clark County with nearby schools including Dean Lamar Allen Elementary School, Edmundo "Eddie" Escobedo, Sr. Middle School, and Centennial High School.
Ownership History
Date
Name
Owned For
Owner Type
Purchase Details
Closed on
Jan 29, 2009
Sold by
Wells Fargo Bank Na
Bought by
Shahabuddin Shazlynna and Kastner Justin
Current Estimated Value
Home Financials for this Owner
Home Financials are based on the most recent Mortgage that was taken out on this home.
Original Mortgage
$84,000
Outstanding Balance
$52,121
Interest Rate
4.92%
Mortgage Type
Unknown
Purchase Details
Closed on
Sep 26, 2008
Sold by
Plotner Branden N
Bought by
Wells Fargo Bank Na
Purchase Details
Closed on
Jun 13, 2006
Sold by
Richmond American Homes Of Nevada Inc
Bought by
Plotner Branden N
Home Financials for this Owner
Home Financials are based on the most recent Mortgage that was taken out on this home.
Original Mortgage
$239,865
Interest Rate
7.1%
Mortgage Type
Unknown
Create a Home Valuation Report for This Property
The Home Valuation Report is an in-depth analysis detailing your home's value as well as a comparison with similar homes in the area
Home Values in the Area
Average Home Value in this Area
Purchase History
| Date | Buyer | Sale Price | Title Company |
|---|---|---|---|
| Shahabuddin Shazlynna | $105,000 | Ticor Title Las Vegas | |
| Wells Fargo Bank Na | $138,550 | Fidelity National | |
| Plotner Branden N | $252,490 | First Amer Title Co Of Nv |
Source: Public Records
Mortgage History
| Date | Status | Borrower | Loan Amount |
|---|---|---|---|
| Open | Shahabuddin Shazlynna | $84,000 | |
| Previous Owner | Plotner Branden N | $239,865 |
Source: Public Records
Tax History Compared to Growth
Tax History
| Year | Tax Paid | Tax Assessment Tax Assessment Total Assessment is a certain percentage of the fair market value that is determined by local assessors to be the total taxable value of land and additions on the property. | Land | Improvement |
|---|---|---|---|---|
| 2025 | $1,521 | $85,893 | $28,700 | $57,193 |
| 2024 | $1,409 | $85,893 | $28,700 | $57,193 |
| 2023 | $1,409 | $83,032 | $29,400 | $53,632 |
| 2022 | $1,305 | $72,875 | $23,800 | $49,075 |
| 2021 | $1,208 | $68,318 | $21,700 | $46,618 |
| 2020 | $1,119 | $67,506 | $21,350 | $46,156 |
| 2019 | $1,049 | $63,712 | $18,550 | $45,162 |
| 2018 | $1,001 | $58,466 | $15,050 | $43,416 |
| 2017 | $1,668 | $50,878 | $12,600 | $38,278 |
| 2016 | $938 | $43,785 | $9,800 | $33,985 |
| 2015 | $935 | $36,602 | $7,000 | $29,602 |
| 2014 | $906 | $26,811 | $7,000 | $19,811 |
Source: Public Records
Map
Nearby Homes
- 8451 Quarentina Ave
- 8448 Quarentina Ave
- 8427 Quarentina Ave
- 8407 Sequoia Grove Ave
- 8332 Mountain Heather Ct
- 8321 Mountain Heather Ct
- 8212 Antler Pines Ct
- 6864 Puertollano Place
- 8438 Cabirolera Ave
- 8422 Cabirolera Ave
- 0 N Miller Unit 2686157
- 5889 N Shaumber Rd
- 0 Tropical Pkwy Unit 2720666
- 0 N Miller Unit 2686151
- 8267 Southern Cross Ave
- 6955 N Durango Dr Unit 1041
- 6955 N Durango Dr Unit 2085
- 6955 N Durango Dr Unit 2046
- 6955 N Durango Dr Unit 1013
- 6955 N Durango Dr Unit 1038
- 6715 Moreno Valley St
- 6719 Moreno Valley St
- 6711 Moreno Valley St
- 6723 Moreno Valley St
- 6707 Moreno Valley St
- 6727 Moreno Valley St
- 8448 Viansa Loma Ave
- 8447 Quarentina Ave
- 6731 Moreno Valley St
- 8521 Lawsonia Ct Unit n/a
- 8520 Myrsine Ct
- 8444 Viansa Loma Ave Unit n/a
- 8444 Viansa Loma Ave
- 8443 Quarentina Ave
- 8452 Quarentina Ave
- 6735 Moreno Valley St
- 8520 Lawsonia Ct
- 8525 Lawsonia Ct
- 8524 Myrsine Ct
- 8440 Viansa Loma Ave