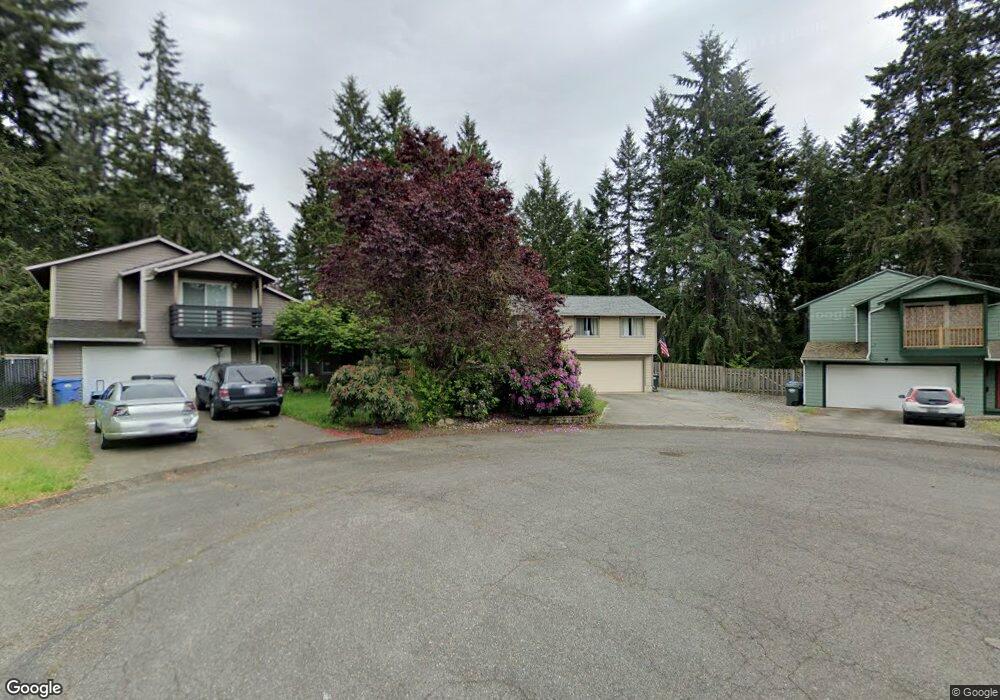
6716 163rd Street Ct E Puyallup, WA 98375
Estimated Value: $466,000 - $552,000
3
Beds
3
Baths
1,526
Sq Ft
$335/Sq Ft
Est. Value
About This Home
This home is located at 6716 163rd Street Ct E, Puyallup, WA 98375 and is currently estimated at $510,513, approximately $334 per square foot. 6716 163rd Street Ct E is a home located in Pierce County with nearby schools including Clover Creek Elementary School, Liberty Middle School, and Graham Kapowsin High School.
Ownership History
Date
Name
Owned For
Owner Type
Purchase Details
Closed on
Jan 6, 2023
Sold by
Langermann Darlene
Bought by
Morris Roger D and Morris Holli C
Current Estimated Value
Home Financials for this Owner
Home Financials are based on the most recent Mortgage that was taken out on this home.
Original Mortgage
$100,000
Outstanding Balance
$95,188
Interest Rate
6.31%
Mortgage Type
Credit Line Revolving
Estimated Equity
$415,325
Purchase Details
Closed on
Feb 13, 2006
Sold by
Morris Roger D
Bought by
Morris Roger D and Morris Holli C
Purchase Details
Closed on
Jun 24, 1998
Sold by
Morris Ray E
Bought by
Morris Roger D and Morris Holli C
Purchase Details
Closed on
Apr 26, 1994
Sold by
Attaway Joel G
Bought by
Morris Ray E
Home Financials for this Owner
Home Financials are based on the most recent Mortgage that was taken out on this home.
Original Mortgage
$96,500
Interest Rate
5.37%
Create a Home Valuation Report for This Property
The Home Valuation Report is an in-depth analysis detailing your home's value as well as a comparison with similar homes in the area
Home Values in the Area
Average Home Value in this Area
Purchase History
| Date | Buyer | Sale Price | Title Company |
|---|---|---|---|
| Morris Roger D | -- | -- | |
| Morris Roger D | -- | None Available | |
| Morris Roger D | $92,212 | -- | |
| Morris Ray E | -- | Rainier Title Company |
Source: Public Records
Mortgage History
| Date | Status | Borrower | Loan Amount |
|---|---|---|---|
| Open | Morris Roger D | $100,000 | |
| Previous Owner | Morris Ray E | $96,500 |
Source: Public Records
Tax History Compared to Growth
Tax History
| Year | Tax Paid | Tax Assessment Tax Assessment Total Assessment is a certain percentage of the fair market value that is determined by local assessors to be the total taxable value of land and additions on the property. | Land | Improvement |
|---|---|---|---|---|
| 2025 | $4,850 | $408,900 | $187,900 | $221,000 |
| 2024 | $4,850 | $439,000 | $202,300 | $236,700 |
| 2023 | $4,850 | $413,500 | $184,700 | $228,800 |
| 2022 | $4,718 | $441,700 | $205,200 | $236,500 |
| 2021 | $4,517 | $321,600 | $141,200 | $180,400 |
| 2019 | $2,999 | $263,700 | $107,900 | $155,800 |
| 2018 | $3,365 | $236,500 | $86,600 | $149,900 |
| 2017 | $3,037 | $212,800 | $78,800 | $134,000 |
| 2016 | $2,680 | $171,400 | $61,400 | $110,000 |
| 2014 | $2,299 | $155,900 | $55,800 | $100,100 |
| 2013 | $2,299 | $138,600 | $46,500 | $92,100 |
Source: Public Records
Map
Nearby Homes
- 16021 67th Avenue Ct E
- 16009 67th Avenue Ct E
- 6421 161st Street Ct E Unit 9
- 16205 63rd Avenue Ct E Unit 207
- 16218 72nd Avenue Ct E
- 6126 161st Street Ct E Unit 26
- 6118 161st Street Ct E Unit 228
- 16216 76th Avenue Ct E
- 15510 67th Avenue Ct E
- 16206 76th Avenue Ct E
- 16212 76th Avenue Ct E
- 16220 76th Avenue Ct E
- 15322 66th Ave E
- 7620 157th Street Ct E Unit 94
- 7705 158th Street Ct E Unit 119
- 17232 74th Avenue Ct E
- 17302 74th Avenue Ct E
- 7918 165th Street Ct E
- 17318 74th Avenue Ct E
- 16428 80th Ave E
- 6714 163rd Street Ct E
- 6717 163rd Street Ct E
- 6815 164th St E
- 6712 163rd Street Ct E
- 6715 163rd Street Ct E
- 6713 163rd Street Ct E
- 6710 163rd Street Ct E
- 6711 163rd Street Ct E
- 6709 163rd Street Ct E
- 6724 162nd Street Ct E
- 6810 162nd Street Ct E
- 6722 162nd Street Ct E
- 6606 163rd Street Ct E
- 6812 162nd Street Ct E
- 6818 164th St E
- 6720 162nd Street Ct E
- 6605 163rd Street Ct E
- 6814 162nd Street Ct E
- 6604 163rd Street Ct E
- 6713 165th Street Ct E