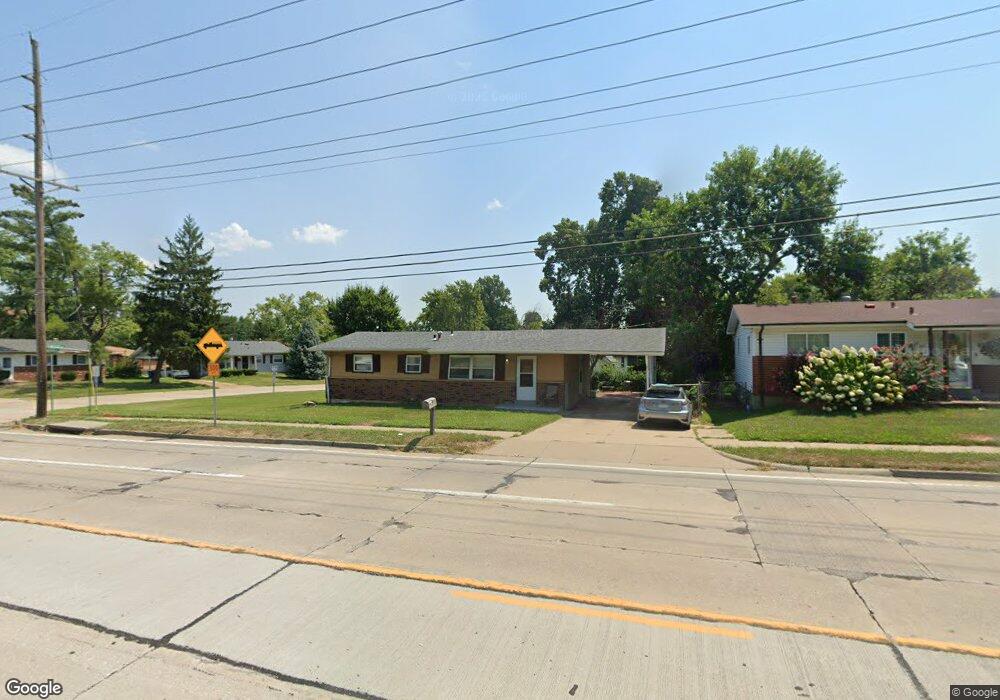
6716 Howdershell Rd Hazelwood, MO 63042
Estimated Value: $153,000 - $176,000
3
Beds
2
Baths
1,008
Sq Ft
$159/Sq Ft
Est. Value
About This Home
This home is located at 6716 Howdershell Rd, Hazelwood, MO 63042 and is currently estimated at $160,588, approximately $159 per square foot. 6716 Howdershell Rd is a home located in St. Louis County with nearby schools including Armstrong Elementary School, West Middle School, and Hazelwood West High School.
Ownership History
Date
Name
Owned For
Owner Type
Purchase Details
Closed on
Jun 30, 2008
Sold by
Faster House Llc
Bought by
Redmonds Properties Llc
Current Estimated Value
Home Financials for this Owner
Home Financials are based on the most recent Mortgage that was taken out on this home.
Original Mortgage
$70,000
Outstanding Balance
$44,781
Interest Rate
5.99%
Mortgage Type
Purchase Money Mortgage
Estimated Equity
$115,807
Purchase Details
Closed on
Jun 13, 2008
Sold by
Alliance Realty Services Llc
Bought by
Fasterhouse Llc
Home Financials for this Owner
Home Financials are based on the most recent Mortgage that was taken out on this home.
Original Mortgage
$70,000
Outstanding Balance
$44,781
Interest Rate
5.99%
Mortgage Type
Purchase Money Mortgage
Estimated Equity
$115,807
Create a Home Valuation Report for This Property
The Home Valuation Report is an in-depth analysis detailing your home's value as well as a comparison with similar homes in the area
Home Values in the Area
Average Home Value in this Area
Purchase History
| Date | Buyer | Sale Price | Title Company |
|---|---|---|---|
| Redmonds Properties Llc | -- | None Available | |
| Fasterhouse Llc | $62,000 | Ort | |
| Alliance Realty Services Llc | $46,000 | Ort |
Source: Public Records
Mortgage History
| Date | Status | Borrower | Loan Amount |
|---|---|---|---|
| Open | Redmonds Properties Llc | $70,000 | |
| Closed | Fasterhouse Llc | $62,000 |
Source: Public Records
Tax History
| Year | Tax Paid | Tax Assessment Tax Assessment Total Assessment is a certain percentage of the fair market value that is determined by local assessors to be the total taxable value of land and additions on the property. | Land | Improvement |
|---|---|---|---|---|
| 2025 | $2,046 | $28,750 | $5,040 | $23,710 |
| 2024 | $2,046 | $25,100 | $3,310 | $21,790 |
| 2023 | $2,076 | $25,100 | $3,310 | $21,790 |
| 2022 | $1,838 | $19,830 | $3,740 | $16,090 |
| 2021 | $1,807 | $19,830 | $3,740 | $16,090 |
| 2020 | $1,773 | $18,210 | $3,310 | $14,900 |
| 2019 | $1,733 | $18,210 | $3,310 | $14,900 |
| 2018 | $1,617 | $15,740 | $2,910 | $12,830 |
| 2017 | $1,605 | $15,740 | $2,910 | $12,830 |
| 2016 | $940 | $9,120 | $2,220 | $6,900 |
Source: Public Records
Map
Nearby Homes
- 6702 Flowervale Dr
- 6.89 +/- Ac Dunn Rd
- 909 Townhouse Ln
- 7057 Howdershell Rd
- 1209 Woodcrest Ln
- 630 Lamplight Ln
- 596 Haventree Dr
- 14 Kenwood Dr
- 7275 Howdershell Rd
- 506 Impala Ln
- 39 Airshire Place
- 1826 Oliveto Ln
- 574 Coach Light Ln
- 1782 Oliveto Ln
- 5439 Ville Rosa Ln
- 525 Fox Crest Dr
- 7415 Foxtrot Dr
- 1640 Tahoe Dr
- 1495 Yaqui Dr
- 1050 Gifford Ct
- 822 Lightwood Dr
- 6714 Howdershell Rd
- 825 Lightwood Dr
- 6715 Vineland Dr
- 6663 Howdershell Rd
- 823 Lightwood Dr
- 6712 Howdershell Rd
- 6713 Vineland Dr
- 821 Lightwood Dr
- 6711 Vineland Dr
- 6653 Howdershell Rd
- 902 Chula Dr
- 819 Lightwood Dr
- 6710 Howdershell Rd
- 903 Altavia Dr
- 6709 Vineland Dr
- 906 Chula Dr
- 905 Chula Dr
- 6714 Vineland Dr
- 6708 Howdershell Rd
Your Personal Tour Guide
Ask me questions while you tour the home.