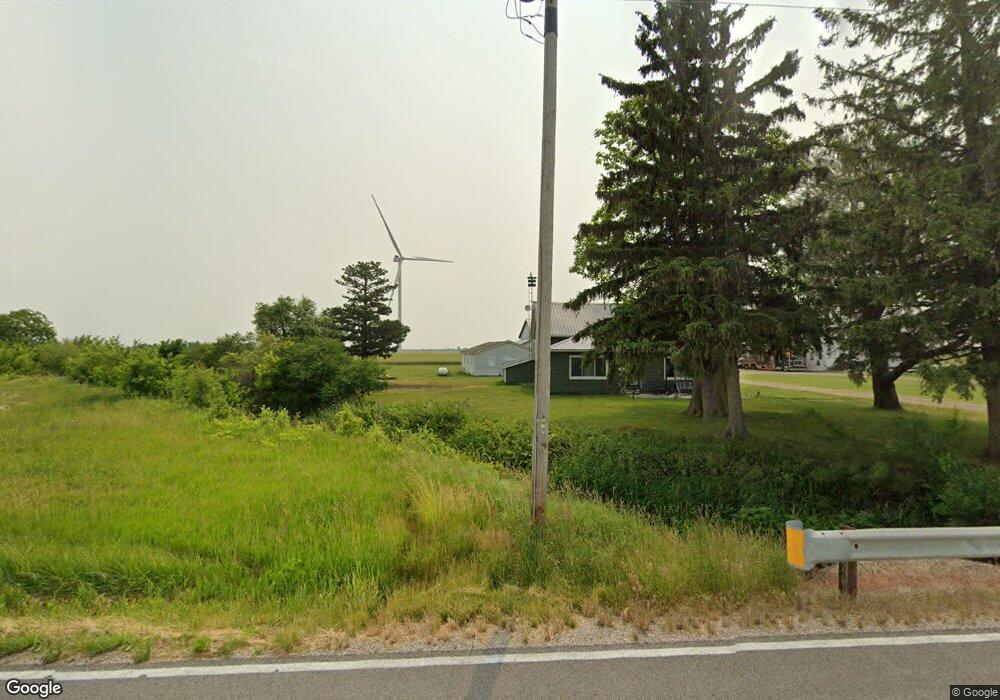
6716 Road 87 Paulding, OH 45879
Estimated Value: $157,808 - $218,000
4
Beds
2
Baths
2,088
Sq Ft
$87/Sq Ft
Est. Value
About This Home
This home is located at 6716 Road 87, Paulding, OH 45879 and is currently estimated at $182,202, approximately $87 per square foot. 6716 Road 87 is a home located in Paulding County with nearby schools including Wayne Trace High School.
Ownership History
Date
Name
Owned For
Owner Type
Purchase Details
Closed on
Aug 30, 2018
Sold by
Foster Shad A and Foster Kelly N
Bought by
Davis Jason D and Davis Tea D
Current Estimated Value
Home Financials for this Owner
Home Financials are based on the most recent Mortgage that was taken out on this home.
Original Mortgage
$43,500
Outstanding Balance
$38,467
Interest Rate
5.37%
Mortgage Type
Adjustable Rate Mortgage/ARM
Estimated Equity
$143,735
Purchase Details
Closed on
Jun 16, 2010
Sold by
Fannie Mae
Bought by
Foster Shad A
Purchase Details
Closed on
Oct 28, 2009
Sold by
Franklin Kari L and Gmac Mortgage Llc
Bought by
Federal National Mortgage Association
Purchase Details
Closed on
Dec 5, 2007
Sold by
Dempsey Dennis and Dempsey Pamela
Bought by
Franklin Kari L
Home Financials for this Owner
Home Financials are based on the most recent Mortgage that was taken out on this home.
Original Mortgage
$102,600
Interest Rate
6.3%
Mortgage Type
New Conventional
Purchase Details
Closed on
Sep 11, 1996
Bought by
Foster Shad A
Create a Home Valuation Report for This Property
The Home Valuation Report is an in-depth analysis detailing your home's value as well as a comparison with similar homes in the area
Home Values in the Area
Average Home Value in this Area
Purchase History
| Date | Buyer | Sale Price | Title Company |
|---|---|---|---|
| Davis Jason D | $63,500 | None Available | |
| Foster Shad A | $33,000 | None Available | |
| Federal National Mortgage Association | $56,000 | None Available | |
| Franklin Kari L | $108,000 | None Available | |
| Foster Shad A | $65,000 | -- |
Source: Public Records
Mortgage History
| Date | Status | Borrower | Loan Amount |
|---|---|---|---|
| Open | Davis Jason D | $43,500 | |
| Previous Owner | Franklin Kari L | $102,600 |
Source: Public Records
Tax History Compared to Growth
Tax History
| Year | Tax Paid | Tax Assessment Tax Assessment Total Assessment is a certain percentage of the fair market value that is determined by local assessors to be the total taxable value of land and additions on the property. | Land | Improvement |
|---|---|---|---|---|
| 2024 | $1,201 | $36,120 | $7,770 | $28,350 |
| 2023 | $1,201 | $36,120 | $7,770 | $28,350 |
| 2022 | $1,195 | $36,120 | $7,770 | $28,350 |
| 2021 | $1,069 | $29,400 | $7,420 | $21,980 |
| 2020 | $1,126 | $29,400 | $7,420 | $21,980 |
| 2019 | $1,132 | $26,530 | $7,420 | $19,110 |
| 2018 | $934 | $26,530 | $7,420 | $19,110 |
| 2017 | $936 | $26,530 | $7,420 | $19,110 |
| 2016 | $935 | $26,530 | $7,420 | $19,110 |
| 2015 | $818 | $24,190 | $6,650 | $17,540 |
| 2014 | $828 | $24,190 | $6,650 | $17,540 |
| 2013 | $993 | $26,150 | $6,650 | $19,500 |
Source: Public Records
Map
Nearby Homes
- 12783 Road 82
- 225 2nd St
- 100 Proxmire St
- 720 W Wayne St
- 717 W Harrison St
- 720 W Perry St
- 412 S Laura St
- 300 S Williams St
- 0 Road 72
- 614 W Jackson St
- 215 N Dewitt St
- 6312 Meadowlark Ln
- 600 W Merrin St
- 752 N Dix St
- 14255 Road 126
- 606 Lincoln Ave
- 418 E Baldwin St
- 907 Country View Dr
- Tract 2 - 0000 Ohio 111
- 0000 Ohio 111