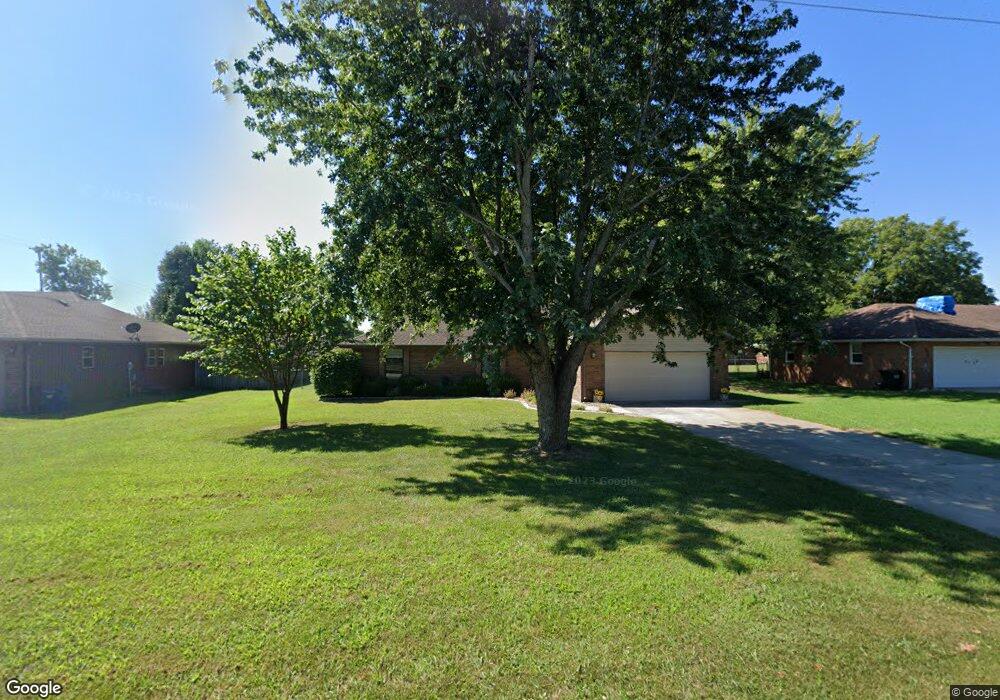
6716 W Lone Oak St Springfield, MO 65803
Estimated Value: $213,000 - $263,000
3
Beds
2
Baths
1,455
Sq Ft
$166/Sq Ft
Est. Value
About This Home
This home is located at 6716 W Lone Oak St, Springfield, MO 65803 and is currently estimated at $242,115, approximately $166 per square foot. 6716 W Lone Oak St is a home located in Greene County with nearby schools including Willard Central Elementary School, Willard Intermediate School North, and Willard High School.
Ownership History
Date
Name
Owned For
Owner Type
Purchase Details
Closed on
May 14, 2021
Sold by
Cook Lori Lynn and Cook Robert Ryan
Bought by
Rodman Tanille
Current Estimated Value
Home Financials for this Owner
Home Financials are based on the most recent Mortgage that was taken out on this home.
Original Mortgage
$175,655
Outstanding Balance
$159,187
Interest Rate
3.1%
Mortgage Type
New Conventional
Estimated Equity
$82,928
Purchase Details
Closed on
Aug 16, 2019
Sold by
Flood Lori L and Cook Robert Ryan
Bought by
Cook Lori Lynn and Cook Robert Ryan
Home Financials for this Owner
Home Financials are based on the most recent Mortgage that was taken out on this home.
Original Mortgage
$110,000
Interest Rate
3.7%
Mortgage Type
New Conventional
Purchase Details
Closed on
May 16, 2011
Sold by
Carpenter Carolyn E and Flood Carolyn
Bought by
Flood Lori L
Home Financials for this Owner
Home Financials are based on the most recent Mortgage that was taken out on this home.
Original Mortgage
$85,850
Interest Rate
4.87%
Mortgage Type
FHA
Create a Home Valuation Report for This Property
The Home Valuation Report is an in-depth analysis detailing your home's value as well as a comparison with similar homes in the area
Home Values in the Area
Average Home Value in this Area
Purchase History
| Date | Buyer | Sale Price | Title Company |
|---|---|---|---|
| Rodman Tanille | -- | None Available | |
| Cook Lori Lynn | -- | None Available | |
| Flood Lori L | -- | Choice Escrow & Land Title L |
Source: Public Records
Mortgage History
| Date | Status | Borrower | Loan Amount |
|---|---|---|---|
| Open | Rodman Tanille | $175,655 | |
| Previous Owner | Cook Lori Lynn | $110,000 | |
| Previous Owner | Flood Lori L | $85,850 |
Source: Public Records
Tax History Compared to Growth
Tax History
| Year | Tax Paid | Tax Assessment Tax Assessment Total Assessment is a certain percentage of the fair market value that is determined by local assessors to be the total taxable value of land and additions on the property. | Land | Improvement |
|---|---|---|---|---|
| 2025 | $1,471 | $29,700 | $6,840 | $22,860 |
| 2024 | $1,471 | $25,570 | $4,370 | $21,200 |
| 2023 | $1,466 | $25,570 | $4,370 | $21,200 |
| 2022 | $1,273 | $22,760 | $4,370 | $18,390 |
| 2021 | $1,273 | $22,760 | $4,370 | $18,390 |
| 2020 | $1,136 | $19,950 | $4,370 | $15,580 |
| 2019 | $1,130 | $19,950 | $4,370 | $15,580 |
| 2018 | $1,103 | $19,270 | $4,370 | $14,900 |
| 2017 | $1,094 | $19,270 | $4,370 | $14,900 |
| 2016 | $1,089 | $19,270 | $4,370 | $14,900 |
| 2015 | $1,080 | $19,270 | $4,370 | $14,900 |
| 2014 | $1,089 | $19,270 | $4,370 | $14,900 |
Source: Public Records
Map
Nearby Homes
- 6830 W Lone Oak St
- 6919 W Lone Oak St
- 6984 W Cottonwood Rd
- 7047 W Lone Oak St
- 2506 N Meadow Lake Dr
- 2571 N Honeysuckle Way
- 11550 N Farm Road 101
- 2588 N Farm Road 103
- 6092 W Farm Road 114
- 2548 Arrow Ln N
- 7593 W Farm Road 124
- 1700 N Farm Road 93
- 000 W Farm Road 94
- 6085 W Farm Road 94
- 2007 N Farm Road 89
- 7546 Persimmon Ct
- 7906 W Farm Road 94
- 457 E Warhorse Ln
- 719 Shelley St
- 3610 N Farm Road 115
- 6726 W Lone Oak St
- 6706 W Lone Oak St
- 6715 W Dogwood St
- 6705 W Dogwood St
- 6725 W Dogwood St
- 6736 W Lone Oak St
- 6735 W Dogwood St
- 2730 W Farm Road 112
- 2821 N Farm Road 101
- 6746 W Lone Oak St
- 6745 W Dogwood St
- 6716 W Dogwood St
- 6706 W Dogwood St
- 6726 W Dogwood St
- 2740 N Farm Road 101
- 6736 W Dogwood St
- 6756 W Lone Oak St
- 6755 W Dogwood St
- 2840 N Farm Road 101
- 6746 W Dogwood St