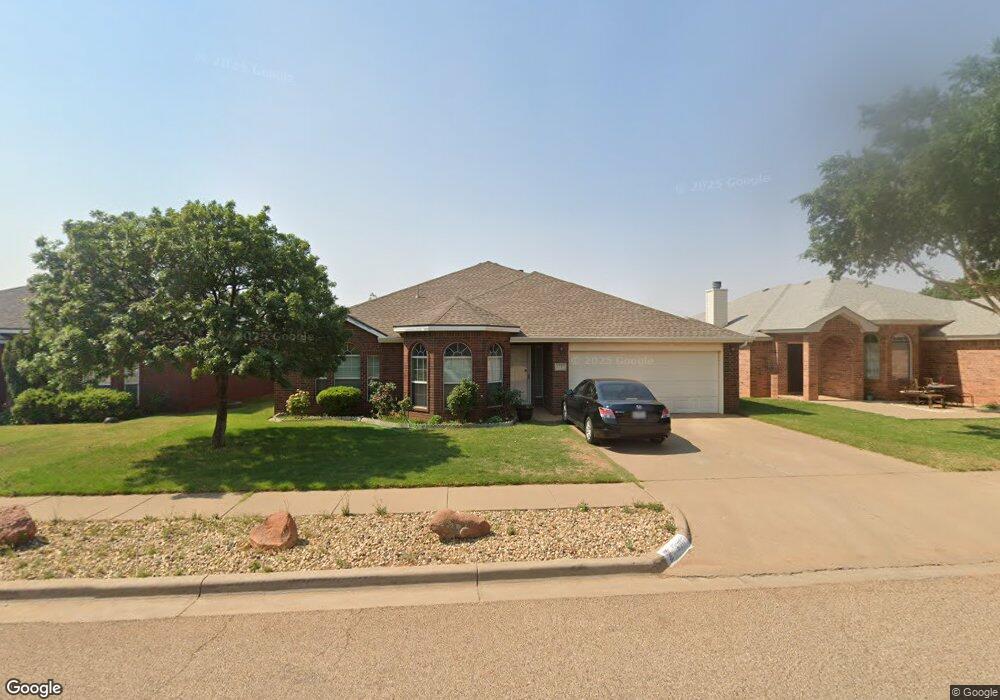
6717 87th St Lubbock, TX 79424
Estimated Value: $253,000 - $256,000
4
Beds
2
Baths
2,069
Sq Ft
$123/Sq Ft
Est. Value
About This Home
This home is located at 6717 87th St, Lubbock, TX 79424 and is currently estimated at $254,321, approximately $122 per square foot. 6717 87th St is a home located in Lubbock County with nearby schools including Oak Ridge Elementary School, Heritage Middle School, and Frenship High School.
Ownership History
Date
Name
Owned For
Owner Type
Purchase Details
Closed on
Mar 12, 2015
Sold by
Collins Basil D and Collins Diane
Bought by
Nguyen Tani and Khong Chinh
Current Estimated Value
Home Financials for this Owner
Home Financials are based on the most recent Mortgage that was taken out on this home.
Original Mortgage
$151,210
Outstanding Balance
$113,946
Interest Rate
3.25%
Mortgage Type
FHA
Estimated Equity
$140,375
Purchase Details
Closed on
Feb 21, 2003
Sold by
Monterey I Ltd
Bought by
Nguyen Tani
Purchase Details
Closed on
Nov 11, 2002
Sold by
Monterey Ii Ltd
Bought by
Nguyen Tani
Create a Home Valuation Report for This Property
The Home Valuation Report is an in-depth analysis detailing your home's value as well as a comparison with similar homes in the area
Home Values in the Area
Average Home Value in this Area
Purchase History
| Date | Buyer | Sale Price | Title Company |
|---|---|---|---|
| Nguyen Tani | $151,210 | Stewart Title Of Lubbock Inc | |
| Nguyen Tani | -- | -- | |
| Nguyen Tani | -- | -- |
Source: Public Records
Mortgage History
| Date | Status | Borrower | Loan Amount |
|---|---|---|---|
| Open | Nguyen Tani | $151,210 |
Source: Public Records
Tax History Compared to Growth
Tax History
| Year | Tax Paid | Tax Assessment Tax Assessment Total Assessment is a certain percentage of the fair market value that is determined by local assessors to be the total taxable value of land and additions on the property. | Land | Improvement |
|---|---|---|---|---|
| 2025 | $4,700 | $249,049 | $8,000 | $241,049 |
| 2024 | $4,700 | $246,184 | $8,000 | $238,184 |
| 2023 | $4,901 | $234,040 | $8,000 | $226,040 |
| 2022 | $4,844 | $212,764 | $8,000 | $215,214 |
| 2021 | $4,678 | $193,422 | $8,000 | $185,422 |
| 2020 | $4,358 | $179,363 | $8,000 | $171,363 |
| 2019 | $4,398 | $175,922 | $8,000 | $167,922 |
| 2018 | $4,349 | $173,743 | $8,000 | $165,743 |
| 2017 | $4,191 | $167,237 | $8,000 | $159,237 |
| 2016 | $4,094 | $163,386 | $8,000 | $155,386 |
| 2015 | $2,558 | $152,512 | $8,000 | $144,512 |
| 2014 | $2,558 | $141,594 | $8,000 | $133,594 |
Source: Public Records
Map
Nearby Homes