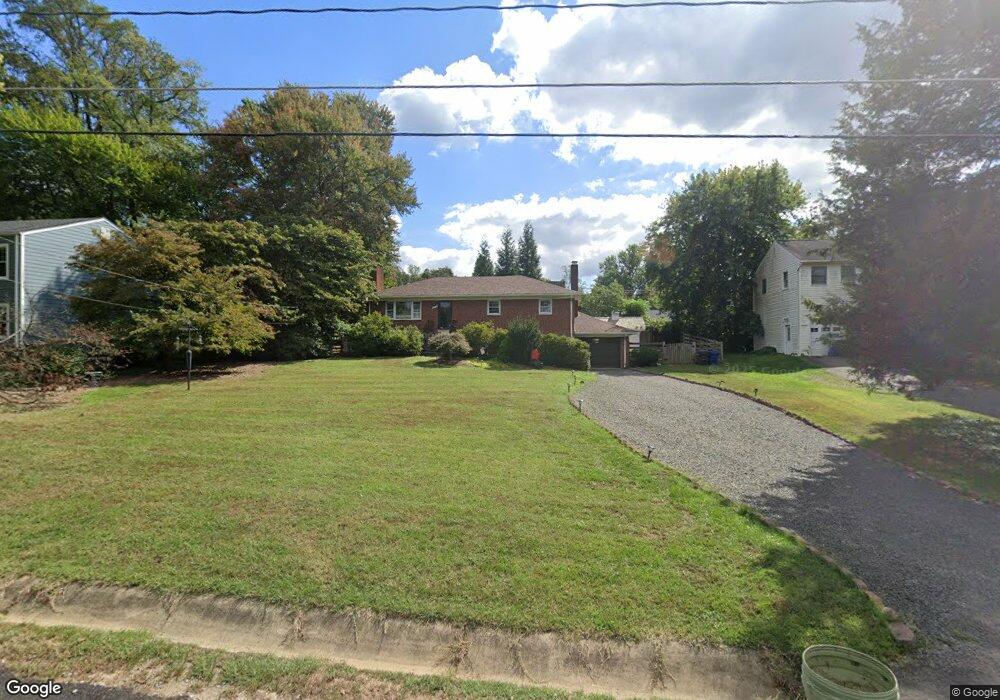
6719 Montour Dr Falls Church, VA 22043
Estimated Value: $1,080,000 - $1,287,000
4
Beds
3
Baths
1,248
Sq Ft
$954/Sq Ft
Est. Value
About This Home
This home is located at 6719 Montour Dr, Falls Church, VA 22043 and is currently estimated at $1,190,493, approximately $953 per square foot. 6719 Montour Dr is a home located in Fairfax County with nearby schools including Haycock Elementary School, Longfellow Middle School, and Acton Academy Falls Church.
Ownership History
Date
Name
Owned For
Owner Type
Purchase Details
Closed on
Jun 2, 2021
Sold by
Russell Robin L and Russell Lisa C
Bought by
Russell Robin L and Russell Lisa C
Current Estimated Value
Purchase Details
Closed on
Jun 2, 2004
Sold by
Renda Susan
Bought by
Russell Robin L
Home Financials for this Owner
Home Financials are based on the most recent Mortgage that was taken out on this home.
Original Mortgage
$316,000
Outstanding Balance
$153,851
Interest Rate
5.94%
Mortgage Type
New Conventional
Estimated Equity
$1,036,642
Create a Home Valuation Report for This Property
The Home Valuation Report is an in-depth analysis detailing your home's value as well as a comparison with similar homes in the area
Home Values in the Area
Average Home Value in this Area
Purchase History
| Date | Buyer | Sale Price | Title Company |
|---|---|---|---|
| Russell Robin L | -- | None Available | |
| Russell Robin L | $395,000 | -- |
Source: Public Records
Mortgage History
| Date | Status | Borrower | Loan Amount |
|---|---|---|---|
| Open | Russell Robin L | $316,000 |
Source: Public Records
Tax History Compared to Growth
Tax History
| Year | Tax Paid | Tax Assessment Tax Assessment Total Assessment is a certain percentage of the fair market value that is determined by local assessors to be the total taxable value of land and additions on the property. | Land | Improvement |
|---|---|---|---|---|
| 2025 | $11,584 | $1,024,880 | $598,000 | $426,880 |
| 2024 | $11,584 | $918,710 | $493,000 | $425,710 |
| 2023 | $10,417 | $853,230 | $438,000 | $415,230 |
| 2022 | $9,872 | $797,360 | $438,000 | $359,360 |
| 2021 | $9,529 | $755,360 | $396,000 | $359,360 |
| 2020 | $9,477 | $747,360 | $388,000 | $359,360 |
| 2019 | $8,704 | $682,690 | $353,000 | $329,690 |
| 2018 | $8,245 | $647,370 | $353,000 | $294,370 |
| 2017 | $7,989 | $638,600 | $350,000 | $288,600 |
| 2016 | $8,168 | $653,790 | $350,000 | $303,790 |
| 2015 | $7,391 | $610,590 | $324,000 | $286,590 |
| 2014 | $6,950 | $573,590 | $287,000 | $286,590 |
Source: Public Records
Map
Nearby Homes
- 6712 Moly Dr
- 6616 Fisher Ave
- 2202 Grayson Place
- 6616 Kirby Ct
- 2221 Orchid Dr
- 6610 Quinten St
- 6613 Fisher Ave
- 6545 Placid St
- 6609 Rockmont Ct
- 2300 Meridian St
- 6707 Hallwood Ave
- 6703 Hallwood Ave
- 2118 Greenwich St
- 6927 Haycock Rd
- 2240 Highland Terrace
- 6601 Gordon Ave
- 6607 Midhill Place
- 2125 Hilltop Place
- 2302 Westmoreland St
- 6975 Idylwood Rd
- 6715 Montour Dr
- 6723 Montour Dr
- 6706 Haycock Rd
- 6711 Montour Dr
- 6712 Haycock Rd
- 6702 Haycock Rd
- 6727 Montour Dr
- 6720 Montour Dr
- 6714 Haycock Rd
- 6707 Montour Dr
- 6712 Montour Dr
- 6724 Montour Dr
- 6700 Haycock Rd
- 6731 Montour Dr
- 6708 Montour Dr
- 6711 Haycock Rd
- 6716 Haycock Rd
- 2155 Royal Lodge Dr
- 2157 Royal Lodge Dr
- 6703 Montour Dr