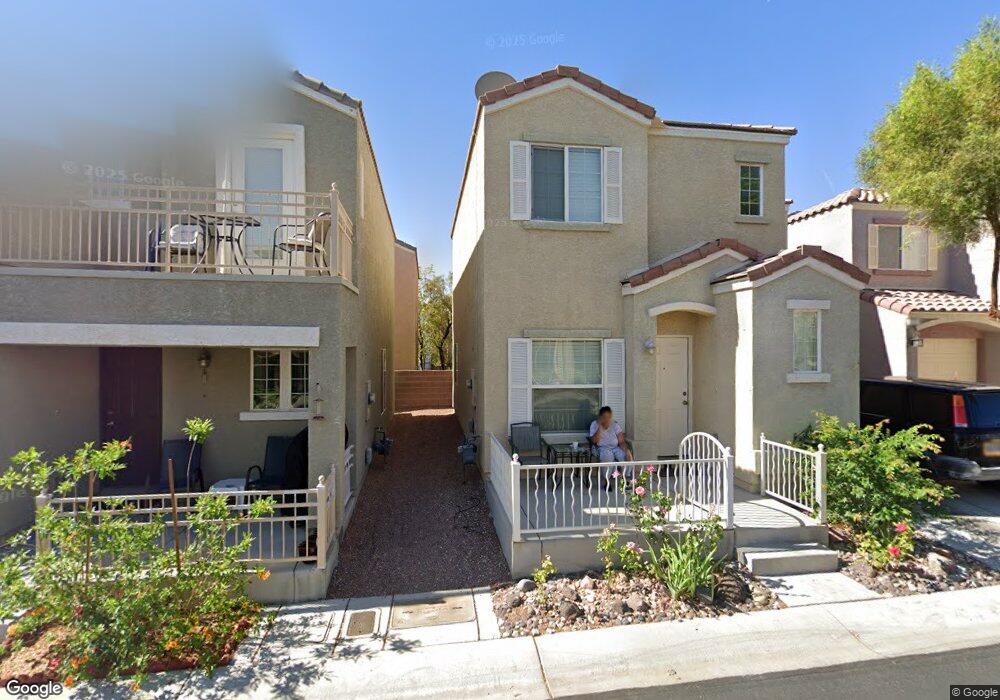
6719 Oxendale Ave Unit na Las Vegas, NV 89139
Coronado Ranch NeighborhoodEstimated Value: $347,998
3
Beds
3
Baths
1,230
Sq Ft
$283/Sq Ft
Est. Value
About This Home
This home is located at 6719 Oxendale Ave Unit na, Las Vegas, NV 89139 and is currently priced at $347,998, approximately $282 per square foot. 6719 Oxendale Ave Unit na is a home located in Clark County with nearby schools including Lawrence & Heidi Canarelli Middle School, Sierra Vista High School, and Legacy Traditional School - SW Las Vegas.
Ownership History
Date
Name
Owned For
Owner Type
Purchase Details
Closed on
May 21, 2014
Sold by
Federal Home Loan Mortgage Corporation
Bought by
Beraki Abeba T
Current Estimated Value
Home Financials for this Owner
Home Financials are based on the most recent Mortgage that was taken out on this home.
Original Mortgage
$140,409
Outstanding Balance
$108,058
Interest Rate
4.75%
Mortgage Type
FHA
Purchase Details
Closed on
Feb 4, 2014
Sold by
Zampella Doris and Zampella Stephen
Bought by
Federal Home Loan Mortgage Corporation
Purchase Details
Closed on
May 24, 2004
Sold by
Astoria Pinnacle Hd Llc
Bought by
Zampella Stephen and Zampella Doris
Home Financials for this Owner
Home Financials are based on the most recent Mortgage that was taken out on this home.
Original Mortgage
$120,000
Interest Rate
5.86%
Mortgage Type
Unknown
Create a Home Valuation Report for This Property
The Home Valuation Report is an in-depth analysis detailing your home's value as well as a comparison with similar homes in the area
Home Values in the Area
Average Home Value in this Area
Purchase History
| Date | Buyer | Sale Price | Title Company |
|---|---|---|---|
| Beraki Abeba T | $143,000 | Nevada Title Las Vegas | |
| Federal Home Loan Mortgage Corporation | $121,500 | Premier American Title | |
| Zampella Stephen | $164,250 | First American Title Co Of |
Source: Public Records
Mortgage History
| Date | Status | Borrower | Loan Amount |
|---|---|---|---|
| Open | Beraki Abeba T | $140,409 | |
| Previous Owner | Zampella Stephen | $120,000 |
Source: Public Records
Tax History Compared to Growth
Tax History
| Year | Tax Paid | Tax Assessment Tax Assessment Total Assessment is a certain percentage of the fair market value that is determined by local assessors to be the total taxable value of land and additions on the property. | Land | Improvement |
|---|---|---|---|---|
| 2025 | $1,108 | $83,209 | $28,000 | $55,209 |
| 2024 | $1,077 | $83,209 | $28,000 | $55,209 |
| 2023 | $952 | $77,432 | $25,550 | $51,882 |
| 2022 | $1,045 | $69,159 | $21,700 | $47,459 |
| 2021 | $1,015 | $65,392 | $20,300 | $45,092 |
| 2020 | $982 | $63,905 | $19,250 | $44,655 |
| 2019 | $954 | $60,692 | $16,800 | $43,892 |
| 2018 | $926 | $54,660 | $12,600 | $42,060 |
| 2017 | $1,577 | $53,484 | $11,200 | $42,284 |
| 2016 | $952 | $46,496 | $8,750 | $37,746 |
| 2015 | $875 | $42,820 | $7,350 | $35,470 |
| 2014 | $848 | $27,782 | $3,500 | $24,282 |
Source: Public Records
Map
Nearby Homes
- 6686 Catoctin Ave
- 6686 Oxendale Ave Unit 3
- 6711 Churnet Valley Ave
- 7381 Chrome Hill St
- 6677 Topley Pike Ave
- 7526 Gossamer Wind St
- 6645 Churnet Valley Ave
- 7369 Chrome Hill St
- 6655 Tranquil Seas Ct
- 6635 Topley Pike Ave
- 6599 Netherseal Ave
- 6679 Higger Tor Ave
- 6790 W Oak Mist Ave
- 7520 Fontera Ct
- 6538 Netherseal Ave
- 7609 Belgian Lion St
- 6584 Cotsfield Ave
- 7550 Jacaranda Bay St
- 6650 W Warm Springs Rd Unit 2158
- 6650 W Warm Springs Rd Unit 2118
- 6719 Oxendale Ave
- 6715 Oxendale Ave
- 6723 Oxendale Ave
- 6716 Burbage Ave
- 6712 Burbage Ave Unit 3
- 6720 Burbage Ave
- 6711 Oxendale Ave Unit n/a
- 6711 Oxendale Ave
- 6727 Oxendale Ave Unit 3
- 6708 Burbage Ave
- 6718 Oxendale Ave
- 6724 Burbage Ave
- 6722 Oxendale Ave
- 6714 Oxendale Ave
- 6726 Oxendale Ave
- 6707 Oxendale Ave
- 6731 Oxendale Ave
- 6710 Oxendale Ave
- 6704 Burbage Ave
- 6728 Burbage Ave