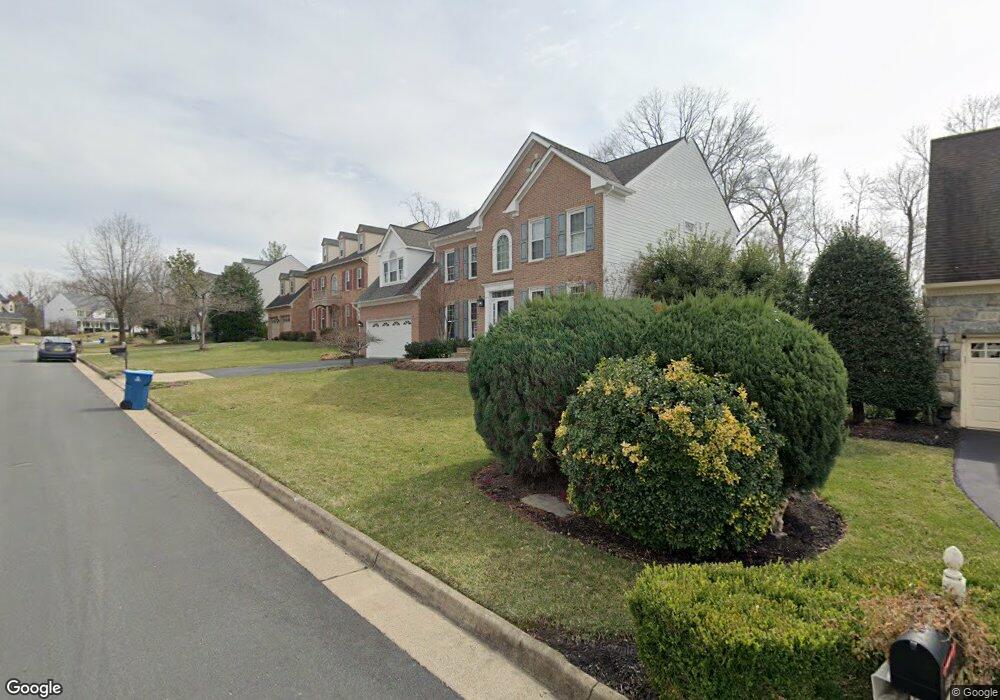
6719 Rock Fall Ct Clifton, VA 20124
Estimated Value: $1,190,633 - $1,293,000
5
Beds
5
Baths
3,956
Sq Ft
$312/Sq Ft
Est. Value
About This Home
This home is located at 6719 Rock Fall Ct, Clifton, VA 20124 and is currently estimated at $1,235,158, approximately $312 per square foot. 6719 Rock Fall Ct is a home located in Fairfax County with nearby schools including Union Mill Elementary School, Liberty Middle School, and Centreville High School.
Ownership History
Date
Name
Owned For
Owner Type
Purchase Details
Closed on
Jun 21, 2024
Sold by
Mary Leslie Oconnor Trust and Oconnor Mary Leslie
Bought by
Jensen Nathan and Jensen Kelly
Current Estimated Value
Home Financials for this Owner
Home Financials are based on the most recent Mortgage that was taken out on this home.
Original Mortgage
$875,000
Outstanding Balance
$862,674
Interest Rate
6.5%
Mortgage Type
New Conventional
Estimated Equity
$372,484
Purchase Details
Closed on
Jan 6, 2000
Sold by
Mitchell Kenneth M
Bought by
Baisden Barry J
Home Financials for this Owner
Home Financials are based on the most recent Mortgage that was taken out on this home.
Original Mortgage
$253,000
Interest Rate
8.23%
Purchase Details
Closed on
Jun 22, 1998
Sold by
Pociask James R
Bought by
Mitchell Kenneth M
Home Financials for this Owner
Home Financials are based on the most recent Mortgage that was taken out on this home.
Original Mortgage
$180,000
Interest Rate
7.09%
Create a Home Valuation Report for This Property
The Home Valuation Report is an in-depth analysis detailing your home's value as well as a comparison with similar homes in the area
Home Values in the Area
Average Home Value in this Area
Purchase History
| Date | Buyer | Sale Price | Title Company |
|---|---|---|---|
| Jensen Nathan | $1,250,000 | Old Republic National Title In | |
| Baisden Barry J | $990,000 | -- | |
| Mitchell Kenneth M | $380,000 | -- |
Source: Public Records
Mortgage History
| Date | Status | Borrower | Loan Amount |
|---|---|---|---|
| Open | Jensen Nathan | $875,000 | |
| Previous Owner | Baisden Barry J | $253,000 | |
| Previous Owner | Mitchell Kenneth M | $180,000 |
Source: Public Records
Tax History
| Year | Tax Paid | Tax Assessment Tax Assessment Total Assessment is a certain percentage of the fair market value that is determined by local assessors to be the total taxable value of land and additions on the property. | Land | Improvement |
|---|---|---|---|---|
| 2025 | $11,351 | $1,048,020 | $301,000 | $747,020 |
| 2024 | $11,351 | $979,840 | $281,000 | $698,840 |
| 2023 | $11,141 | $987,280 | $281,000 | $706,280 |
| 2022 | $10,121 | $885,100 | $251,000 | $634,100 |
| 2021 | $9,155 | $780,120 | $221,000 | $559,120 |
| 2020 | $8,949 | $756,170 | $211,000 | $545,170 |
| 2019 | $8,600 | $726,650 | $211,000 | $515,650 |
| 2018 | $8,322 | $723,650 | $208,000 | $515,650 |
| 2017 | $8,238 | $709,540 | $204,000 | $505,540 |
| 2016 | $8,039 | $693,920 | $200,000 | $493,920 |
Source: Public Records
Map
Nearby Homes
- 13918 Rock Brook Ct
- 13910 Stonefield Ln
- 6902 Compton Heights Cir
- 6125 Sandstone Ct
- 13209 Johnny Moore Ln
- 6808 Cedar Loch Ct
- 6112 Sandstone Ct
- 6789 Stone Maple Terrace
- 13406 Compton Rd
- 14012 Betsy Ross Ln
- 14135 Betsy Ross Ln
- 6311 Betsy Ross Ct
- 7003 Centreville Rd
- 7421 Lake Dr
- 6377 Saint Timothys Ln
- 13855 Laura Ratcliff Ct
- 14097 Winding Ridge Ln
- 7106 Centreville Rd
- 14504 Ravenscar Ct
- 6504 Sharps Dr
- 6717 Rock Fall Ct
- 6721 Rock Fall Ct
- 13776 Laurel Rock Dr
- 6715 Rock Fall Ct
- 13782 Laurel Rock Dr
- 6723 Rock Fall Ct
- 6720 Rock Fall Ct
- 13774 Laurel Rock Dr
- 6718 Rock Fall Ct
- 13780 Laurel Rock Dr
- 6722 Rock Fall Ct
- 6716 Rock Fall Ct
- 13778 Laurel Rock Dr
- 6711 Rock Fall Ct
- 6724 Rock Fall Ct
- 13772 Laurel Rock Dr
- 6705 Rock Fall Ct
- 6714 Rock Fall Ct
- 13787 Laurel Rock Dr
- 13770 Laurel Rock Dr