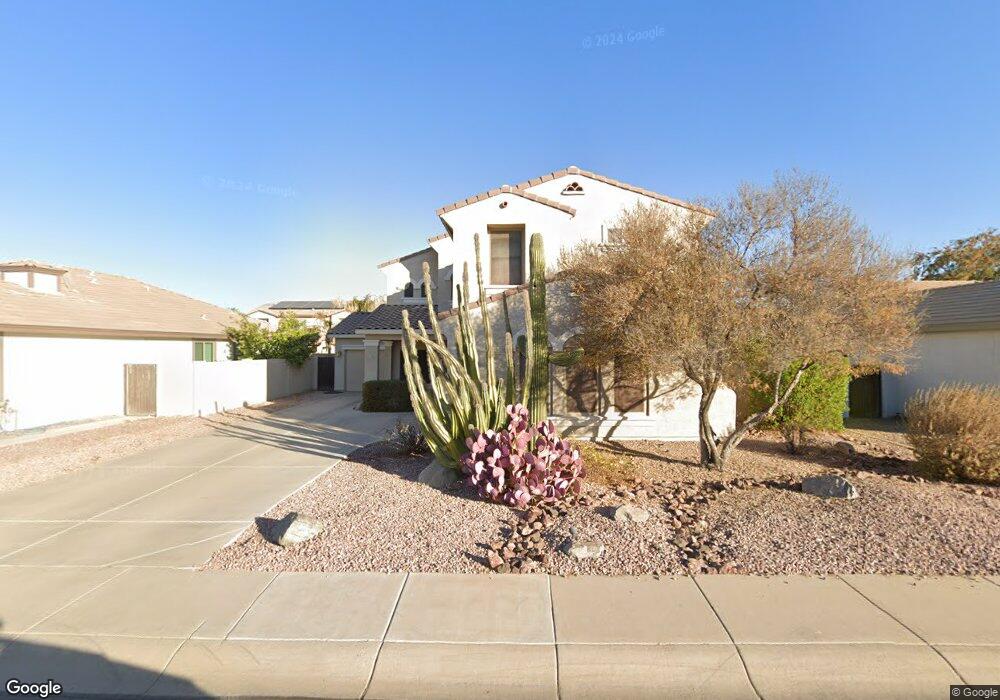
6719 S Pewter Way Chandler, AZ 85249
Sun Groves NeighborhoodEstimated Value: $534,176 - $654,000
--
Bed
4
Baths
2,788
Sq Ft
$220/Sq Ft
Est. Value
About This Home
This home is located at 6719 S Pewter Way, Chandler, AZ 85249 and is currently estimated at $613,544, approximately $220 per square foot. 6719 S Pewter Way is a home located in Maricopa County with nearby schools including Navarrete Elementary School, Willie & Coy Payne Jr. High School, and Rice Elementary School.
Ownership History
Date
Name
Owned For
Owner Type
Purchase Details
Closed on
Jun 4, 2013
Sold by
Deshon Ryan L and Deshon Jocelyn T
Bought by
Deshon Ryan L and Deshon Jocelyn T
Current Estimated Value
Home Financials for this Owner
Home Financials are based on the most recent Mortgage that was taken out on this home.
Original Mortgage
$192,000
Outstanding Balance
$42,817
Interest Rate
3.37%
Mortgage Type
New Conventional
Estimated Equity
$570,727
Purchase Details
Closed on
Nov 19, 2010
Sold by
Deshon Ryan Louis and Deshon Jocelyn Tiepelman
Bought by
Deshon Ryan L and Deshn Jcelyn T
Purchase Details
Closed on
Mar 2, 2005
Sold by
Beazer Homes Sales Arizona Inc
Bought by
Deshon Ryan Louis and Deshon Jocelyn Tiepelman
Home Financials for this Owner
Home Financials are based on the most recent Mortgage that was taken out on this home.
Original Mortgage
$215,400
Interest Rate
5.66%
Mortgage Type
Purchase Money Mortgage
Create a Home Valuation Report for This Property
The Home Valuation Report is an in-depth analysis detailing your home's value as well as a comparison with similar homes in the area
Home Values in the Area
Average Home Value in this Area
Purchase History
| Date | Buyer | Sale Price | Title Company |
|---|---|---|---|
| Deshon Ryan L | -- | Accommodation | |
| Deshon Ryan L | -- | Driggs Title Agency Inc | |
| Deshon Ryan L | -- | None Available | |
| Deshon Ryan Louis | -- | Lawyers Title Of Arizona Inc | |
| Beazer Homes Sales Arizona Inc | -- | Lawyers Title Of Arizona Inc |
Source: Public Records
Mortgage History
| Date | Status | Borrower | Loan Amount |
|---|---|---|---|
| Open | Deshon Ryan L | $192,000 | |
| Closed | Deshon Ryan Louis | $215,400 |
Source: Public Records
Tax History Compared to Growth
Tax History
| Year | Tax Paid | Tax Assessment Tax Assessment Total Assessment is a certain percentage of the fair market value that is determined by local assessors to be the total taxable value of land and additions on the property. | Land | Improvement |
|---|---|---|---|---|
| 2025 | $2,306 | $29,161 | -- | -- |
| 2024 | $2,228 | $27,773 | -- | -- |
| 2023 | $2,228 | $42,580 | $8,510 | $34,070 |
| 2022 | $2,151 | $32,300 | $6,460 | $25,840 |
| 2021 | $2,247 | $29,730 | $5,940 | $23,790 |
| 2020 | $2,236 | $27,770 | $5,550 | $22,220 |
| 2019 | $2,152 | $25,800 | $5,160 | $20,640 |
| 2018 | $2,082 | $24,510 | $4,900 | $19,610 |
| 2017 | $1,942 | $24,610 | $4,920 | $19,690 |
| 2016 | $1,871 | $24,110 | $4,820 | $19,290 |
| 2015 | $1,811 | $23,710 | $4,740 | $18,970 |
Source: Public Records
Map
Nearby Homes
- 6627 S Garnet Way
- 4960 E Colonial Dr
- 1681 E Brigadier Ct
- 4843 E Firestone Dr
- 1725 E Everglade Ln
- 6860 S Crystal Way
- 4633 E Desert Sands Dr
- 25823 S 154th St
- 4633 E Gleneagle Dr
- 4976 E Thunderbird Dr
- 4886 E Thunderbird Dr
- 4523 E Gleneagle Dr
- 4525 E Runaway Bay Dr
- 7941 S Peppertree Dr
- 1928 E La Costa Dr
- 1955 E Blackhawk Dr
- 4660 E Torrey Pines Ln
- 2027 E La Costa Ct
- 1988 E Blackhawk Dr
- 2053 E Saddlebrook Ct
- 6729 S Pewter Way
- 6709 S Pewter Way
- 4967 E Westchester Dr
- 6739 S Pewter Way
- 4957 E Westchester Dr
- 4977 E Westchester Dr
- 6699 S Pewter Way
- 6720 S Pewter Way
- 4987 E Westchester Dr
- 6730 S Pewter Way
- 6710 S Pewter Way
- 4937 E Westchester Dr
- 6749 S Pewter Way
- 6740 S Pewter Way
- 6679 S Pewter Way
- 6700 S Pewter Way
- 4997 E Westchester Dr
- 6680 S Pewter Way
- 6649 S Pewter Way
- 6717 S Garnet Way