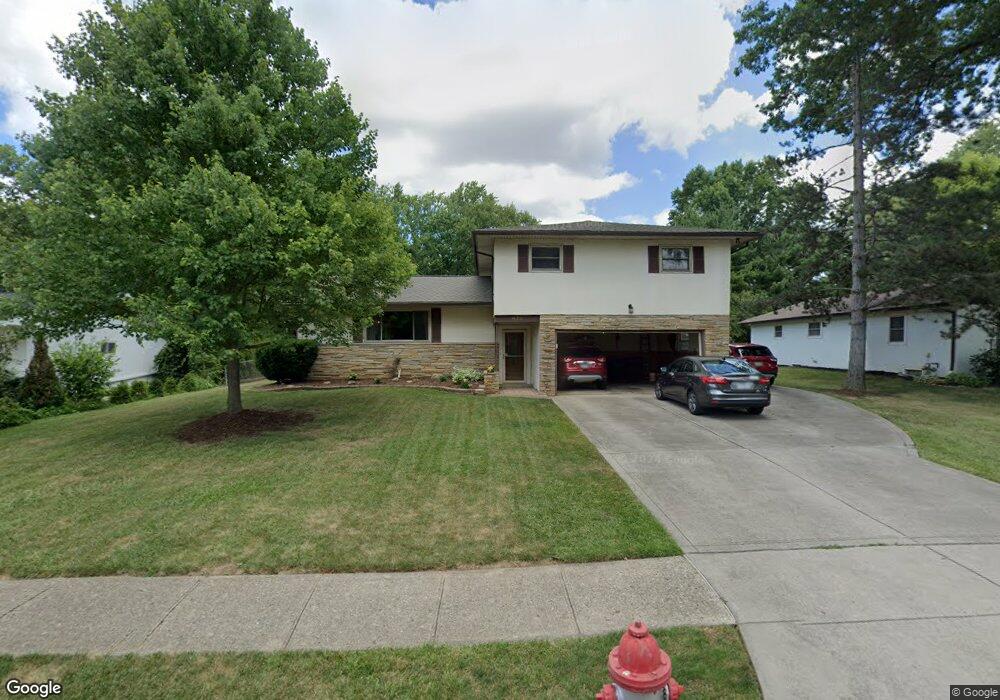
672 Jonsol Ct Columbus, OH 43230
Gahanna-Havens Corners NeighborhoodEstimated Value: $355,154 - $395,000
4
Beds
3
Baths
2,000
Sq Ft
$190/Sq Ft
Est. Value
About This Home
This home is located at 672 Jonsol Ct, Columbus, OH 43230 and is currently estimated at $379,289, approximately $189 per square foot. 672 Jonsol Ct is a home located in Franklin County with nearby schools including Lincoln Elementary School, Gahanna South Middle School, and Lincoln High School.
Ownership History
Date
Name
Owned For
Owner Type
Purchase Details
Closed on
Aug 31, 2007
Sold by
Hoskinson Terry B and Hoskinson Judy Ann
Bought by
Dinovo Dominic V and Dinovo Carolyn A
Current Estimated Value
Home Financials for this Owner
Home Financials are based on the most recent Mortgage that was taken out on this home.
Original Mortgage
$170,999
Outstanding Balance
$107,043
Interest Rate
6.71%
Mortgage Type
Purchase Money Mortgage
Estimated Equity
$272,246
Purchase Details
Closed on
May 27, 1994
Bought by
Hoskinson Terry B
Purchase Details
Closed on
Jun 1, 1987
Purchase Details
Closed on
Jan 1, 1977
Create a Home Valuation Report for This Property
The Home Valuation Report is an in-depth analysis detailing your home's value as well as a comparison with similar homes in the area
Home Values in the Area
Average Home Value in this Area
Purchase History
| Date | Buyer | Sale Price | Title Company |
|---|---|---|---|
| Dinovo Dominic V | $190,000 | Chicago Tit | |
| Hoskinson Terry B | $118,300 | -- | |
| -- | $85,000 | -- | |
| -- | $51,000 | -- |
Source: Public Records
Mortgage History
| Date | Status | Borrower | Loan Amount |
|---|---|---|---|
| Open | Dinovo Dominic V | $170,999 |
Source: Public Records
Tax History
| Year | Tax Paid | Tax Assessment Tax Assessment Total Assessment is a certain percentage of the fair market value that is determined by local assessors to be the total taxable value of land and additions on the property. | Land | Improvement |
|---|---|---|---|---|
| 2025 | $6,058 | $102,830 | $21,630 | $81,200 |
| 2024 | $6,058 | $102,830 | $21,630 | $81,200 |
| 2023 | $5,982 | $102,830 | $21,630 | $81,200 |
| 2022 | $5,724 | $76,650 | $14,630 | $62,020 |
| 2021 | $5,536 | $76,650 | $14,630 | $62,020 |
| 2020 | $5,490 | $76,650 | $14,630 | $62,020 |
| 2019 | $4,605 | $64,160 | $12,180 | $51,980 |
| 2018 | $4,413 | $64,160 | $12,180 | $51,980 |
| 2017 | $4,226 | $64,160 | $12,180 | $51,980 |
| 2016 | $4,251 | $58,770 | $13,130 | $45,640 |
| 2015 | $4,254 | $58,770 | $13,130 | $45,640 |
| 2014 | $4,221 | $58,770 | $13,130 | $45,640 |
| 2013 | $2,074 | $58,135 | $12,495 | $45,640 |
Source: Public Records
Map
Nearby Homes
- 769 Ashford Glen Ct
- 219 N Hamilton Rd
- 701 Hunters Run
- 343 Flint Ridge Dr
- 143 Serran Dr
- 249 Farm Creek Dr
- 329 Cliffview Dr
- 477 Stratshire Ln
- 258 Rocky Fork Dr S
- 206 Lintner St
- 352 Spruce Hill Dr
- 440 Colony Place
- 84 River Dr
- 5901 Stratton Place
- 302 Zander Ln Unit 302
- 167 Lansdowne Ave
- 404 Oberlin St
- 377 Highbury Crescent
- 875 Pinnacle Pointe Place Unit 32
- 970 Claycraft Rd
- 664 Jonsol Ct
- 77 Saint Martins Ct
- 688 Jonsol Ct
- 654 Jonsol Ct
- 78 Saint Martins Ct
- 675 Jonsol Ct
- 669 Jonsol Ct
- 67 Saint Martins Ct
- 646 Jonsol Ct
- 696 Jonsol Ct
- 683 Jonsol Ct
- 76 Saint Stephens Ct
- 659 Jonsol Ct
- 68 Saint Martins Ct
- 70 Saint Stephens Ct
- 68 Saint Martin Ct
- 693 Jonsol Ct
- 649 Jonsol Ct
- 636 Jonsol Ct
- 706 Jonsol Ct
Your Personal Tour Guide
Ask me questions while you tour the home.