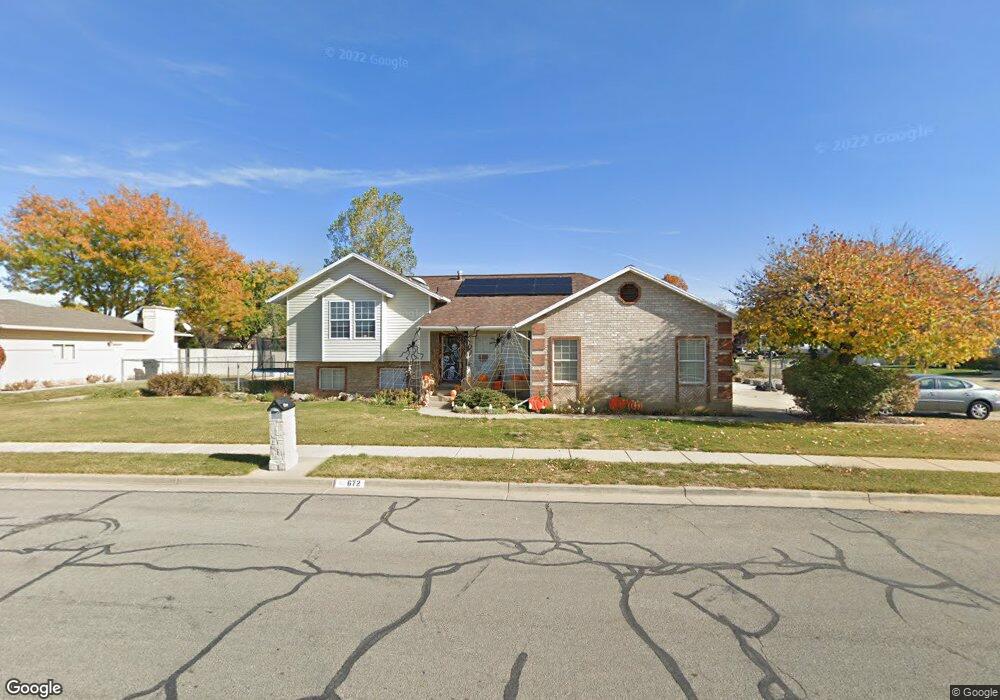
672 N 2575 W Clearfield, UT 84015
Estimated Value: $528,000 - $606,000
6
Beds
4
Baths
2,538
Sq Ft
$224/Sq Ft
Est. Value
About This Home
This home is located at 672 N 2575 W, Clearfield, UT 84015 and is currently estimated at $567,398, approximately $223 per square foot. 672 N 2575 W is a home located in Davis County with nearby schools including Lakeside School, West Point Junior High School, and Syracuse High School.
Ownership History
Date
Name
Owned For
Owner Type
Purchase Details
Closed on
Sep 27, 2021
Sold by
Clark Heidi K and Pabo Clakr Family Revocable Tr
Bought by
Gibson Jared
Current Estimated Value
Home Financials for this Owner
Home Financials are based on the most recent Mortgage that was taken out on this home.
Original Mortgage
$382,087
Outstanding Balance
$347,671
Interest Rate
2.8%
Mortgage Type
New Conventional
Estimated Equity
$219,727
Purchase Details
Closed on
May 8, 2020
Sold by
Clark Heidi K
Bought by
Clark Heidi K and The Pabo Clark Family Revocabl
Purchase Details
Closed on
May 25, 2001
Sold by
Andersen Steven L and Andersen Jolene R
Bought by
Clark Loren B and Clark Heidi K
Home Financials for this Owner
Home Financials are based on the most recent Mortgage that was taken out on this home.
Original Mortgage
$183,340
Interest Rate
7.06%
Mortgage Type
VA
Create a Home Valuation Report for This Property
The Home Valuation Report is an in-depth analysis detailing your home's value as well as a comparison with similar homes in the area
Home Values in the Area
Average Home Value in this Area
Purchase History
| Date | Buyer | Sale Price | Title Company |
|---|---|---|---|
| Gibson Jared | -- | Vanguard Title Ins Union | |
| Gibson Jared | -- | Vanguard Title | |
| Clark Heidi K | -- | None Available | |
| Clark Loren B | -- | First American Title Ins Age |
Source: Public Records
Mortgage History
| Date | Status | Borrower | Loan Amount |
|---|---|---|---|
| Open | Gibson Jared | $382,087 | |
| Closed | Gibson Jared | $382,087 | |
| Previous Owner | Clark Loren B | $183,340 |
Source: Public Records
Tax History
| Year | Tax Paid | Tax Assessment Tax Assessment Total Assessment is a certain percentage of the fair market value that is determined by local assessors to be the total taxable value of land and additions on the property. | Land | Improvement |
|---|---|---|---|---|
| 2025 | $2,958 | $277,200 | $99,890 | $177,310 |
| 2024 | $2,851 | $268,400 | $89,967 | $178,433 |
| 2023 | $2,628 | $455,000 | $109,955 | $345,045 |
| 2022 | $2,843 | $269,500 | $56,594 | $212,906 |
| 2021 | $2,475 | $351,000 | $90,773 | $260,227 |
| 2020 | $2,173 | $304,000 | $75,825 | $228,175 |
| 2019 | $2,276 | $314,000 | $73,694 | $240,306 |
| 2018 | $2,110 | $287,000 | $74,651 | $212,349 |
| 2016 | $1,792 | $128,205 | $28,842 | $99,363 |
| 2015 | $1,804 | $122,320 | $28,842 | $93,478 |
| 2014 | $1,438 | $98,842 | $28,842 | $70,000 |
| 2013 | -- | $100,800 | $33,043 | $67,757 |
Source: Public Records
Map
Nearby Homes
Your Personal Tour Guide
Ask me questions while you tour the home.