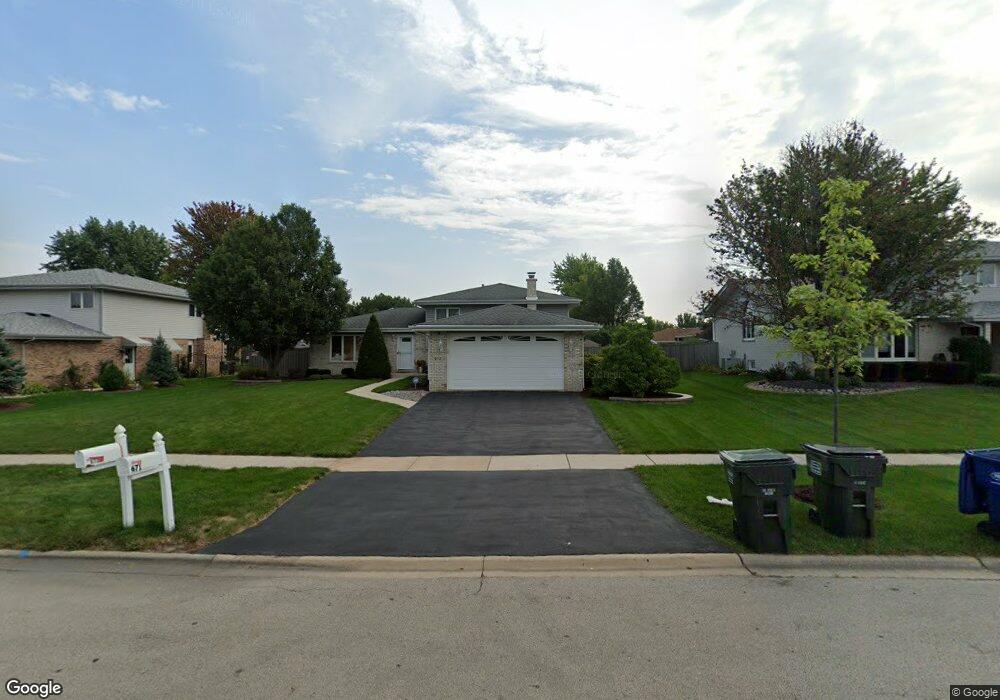
672 Princeton Ln New Lenox, IL 60451
Estimated Value: $414,506 - $445,000
--
Bed
--
Bath
--
Sq Ft
10,019
Sq Ft Lot
About This Home
This home is located at 672 Princeton Ln, New Lenox, IL 60451 and is currently estimated at $424,627. 672 Princeton Ln is a home located in Will County with nearby schools including Spencer Trail, Spencer Crossing Intermediate School, and Spencer Pointe.
Ownership History
Date
Name
Owned For
Owner Type
Purchase Details
Closed on
Mar 10, 2020
Sold by
Piotrowski Kevin and Piotrowski Jennifer J
Bought by
Piotrowski Kevin R and Piotrowski Jennifer J
Current Estimated Value
Home Financials for this Owner
Home Financials are based on the most recent Mortgage that was taken out on this home.
Original Mortgage
$163,000
Outstanding Balance
$144,001
Interest Rate
3.37%
Mortgage Type
New Conventional
Estimated Equity
$280,626
Purchase Details
Closed on
May 8, 2002
Sold by
Piotrowski Kevin and Piotrowski Cassandra
Bought by
Piotrowski Kevin
Purchase Details
Closed on
Jun 15, 1994
Sold by
First National Bank Of Evergreen Park
Bought by
Piotrowski Kevin and Visockis Cassandra
Home Financials for this Owner
Home Financials are based on the most recent Mortgage that was taken out on this home.
Original Mortgage
$127,000
Interest Rate
8.6%
Create a Home Valuation Report for This Property
The Home Valuation Report is an in-depth analysis detailing your home's value as well as a comparison with similar homes in the area
Home Values in the Area
Average Home Value in this Area
Purchase History
| Date | Buyer | Sale Price | Title Company |
|---|---|---|---|
| Piotrowski Kevin R | -- | Old Republic Title | |
| Piotrowski Kevin | -- | -- | |
| Piotrowski Kevin | $151,000 | Chicago Title Insurance Co |
Source: Public Records
Mortgage History
| Date | Status | Borrower | Loan Amount |
|---|---|---|---|
| Open | Piotrowski Kevin R | $163,000 | |
| Closed | Piotrowski Kevin | $127,000 |
Source: Public Records
Tax History Compared to Growth
Tax History
| Year | Tax Paid | Tax Assessment Tax Assessment Total Assessment is a certain percentage of the fair market value that is determined by local assessors to be the total taxable value of land and additions on the property. | Land | Improvement |
|---|---|---|---|---|
| 2024 | $9,440 | $124,329 | $36,393 | $87,936 |
| 2023 | $9,440 | $113,335 | $33,175 | $80,160 |
| 2022 | $8,515 | $104,408 | $30,562 | $73,846 |
| 2021 | $8,080 | $98,193 | $28,743 | $69,450 |
| 2020 | $7,848 | $94,689 | $27,717 | $66,972 |
| 2019 | $7,509 | $91,753 | $26,858 | $64,895 |
| 2018 | $7,334 | $88,590 | $25,932 | $62,658 |
| 2017 | $6,967 | $86,043 | $25,186 | $60,857 |
| 2016 | $6,761 | $83,740 | $24,512 | $59,228 |
| 2015 | $6,543 | $81,104 | $23,740 | $57,364 |
| 2014 | $6,543 | $80,103 | $23,447 | $56,656 |
| 2013 | $6,543 | $81,183 | $23,763 | $57,420 |
Source: Public Records
Map
Nearby Homes
- 1535 Glenbrooke Ln
- 214 Somerset Ct
- 701 Bishops Gate
- 709 Garadice Dr
- 641 Lisson Grove
- 1351 E Lincoln Hwy
- 125 N Anderson Rd
- 513 Somerset Ln
- 449 Somerset Ln Unit 1
- 651 Schooner Dr
- 1017 E Lincoln Hwy
- 1212 Georgias Way
- 1245 Georgias Way
- 1193 Georgias Way
- 2758 Bluestone Bay Dr
- 920 Barnside Rd
- 1139 Georgias Way
- 2667 E Lincoln Hwy
- 1125 Georgias Way
- 203 Tonell Ave
- 682 Princeton Ln
- 662 Princeton Ln
- 671 Dartmouth Ln Unit 2
- 661 Dartmouth Ln
- 681 Dartmouth Ln
- 652 Princeton Ln
- 692 Princeton Ln
- 651 Dartmouth Ln
- 681 Princeton Ln
- 661 Princeton Ln
- 691 Dartmouth Ln
- 642 Princeton Ln
- 651 Princeton Ln
- 691 Princeton Ln
- 641 Dartmouth Ln
- 641 Princeton Ln
- 672 Dartmouth Ln
- 632 Princeton Ln
- 682 Dartmouth Ln
- 662 Dartmouth Ln