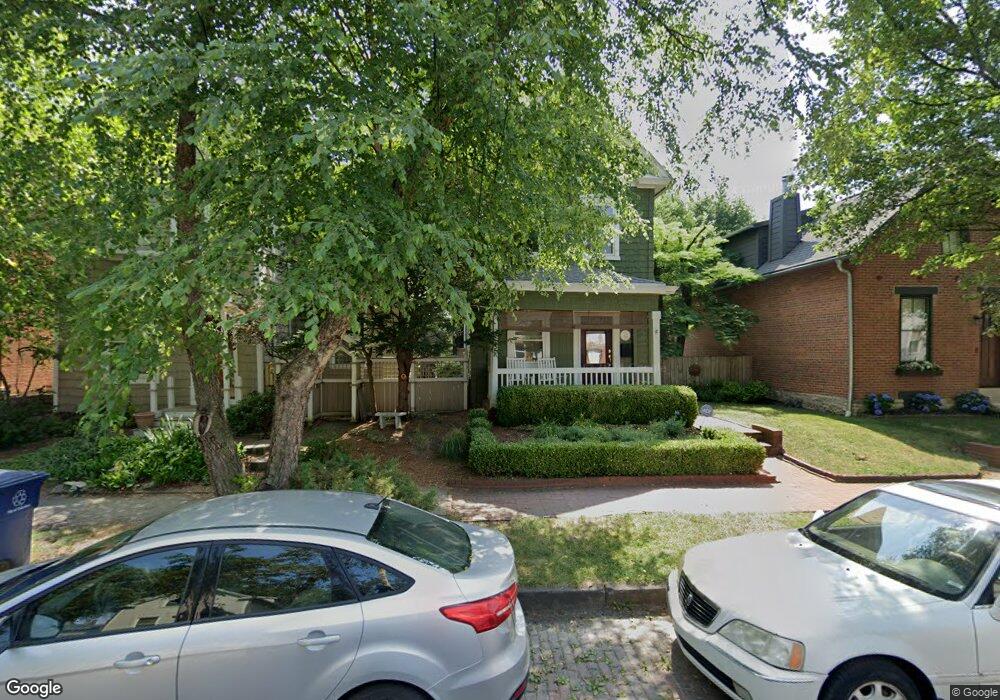
672 S 9th St Columbus, OH 43206
Schumacher Place NeighborhoodEstimated Value: $483,000 - $707,000
4
Beds
2
Baths
2,059
Sq Ft
$272/Sq Ft
Est. Value
About This Home
This home is located at 672 S 9th St, Columbus, OH 43206 and is currently estimated at $560,932, approximately $272 per square foot. 672 S 9th St is a home located in Franklin County with nearby schools including Siebert Elementary School, South High School, and South Columbus Preparatory Academy.
Ownership History
Date
Name
Owned For
Owner Type
Purchase Details
Closed on
Mar 9, 2000
Sold by
Hanby Douglas A
Bought by
Martensen Bradley S and Martensen Kathleen A
Current Estimated Value
Home Financials for this Owner
Home Financials are based on the most recent Mortgage that was taken out on this home.
Original Mortgage
$144,900
Interest Rate
8.26%
Purchase Details
Closed on
Sep 4, 1996
Sold by
Penley Joseph S
Bought by
Douglas A Hanby
Home Financials for this Owner
Home Financials are based on the most recent Mortgage that was taken out on this home.
Original Mortgage
$147,250
Interest Rate
8.27%
Mortgage Type
New Conventional
Purchase Details
Closed on
Sep 14, 1995
Sold by
Lawson Virgil
Bought by
Joseph Scott Penley
Create a Home Valuation Report for This Property
The Home Valuation Report is an in-depth analysis detailing your home's value as well as a comparison with similar homes in the area
Home Values in the Area
Average Home Value in this Area
Purchase History
| Date | Buyer | Sale Price | Title Company |
|---|---|---|---|
| Martensen Bradley S | $170,500 | Amerititle Agency Inc | |
| Douglas A Hanby | $155,000 | -- | |
| Joseph Scott Penley | $86,000 | -- |
Source: Public Records
Mortgage History
| Date | Status | Borrower | Loan Amount |
|---|---|---|---|
| Closed | Martensen Bradley S | $144,900 | |
| Closed | Douglas A Hanby | $147,250 | |
| Closed | Joseph Scott Penley | -- |
Source: Public Records
Tax History
| Year | Tax Paid | Tax Assessment Tax Assessment Total Assessment is a certain percentage of the fair market value that is determined by local assessors to be the total taxable value of land and additions on the property. | Land | Improvement |
|---|---|---|---|---|
| 2025 | $6,311 | $140,630 | $60,970 | $79,660 |
| 2024 | $6,311 | $140,630 | $60,970 | $79,660 |
| 2023 | $6,231 | $140,630 | $60,970 | $79,660 |
| 2022 | $4,399 | $84,810 | $28,880 | $55,930 |
| 2021 | $4,406 | $84,810 | $28,880 | $55,930 |
| 2020 | $4,412 | $84,810 | $28,880 | $55,930 |
| 2019 | $3,941 | $64,970 | $28,880 | $36,090 |
| 2018 | $3,998 | $64,970 | $28,880 | $36,090 |
| 2017 | $5,046 | $83,230 | $48,090 | $35,140 |
| 2016 | $4,475 | $67,550 | $25,270 | $42,280 |
| 2015 | $4,062 | $67,550 | $25,270 | $42,280 |
| 2014 | $4,072 | $67,550 | $25,270 | $42,280 |
| 2013 | $2,008 | $67,550 | $25,270 | $42,280 |
Source: Public Records
Map
Nearby Homes
- 466 South Ln
- 424 Jackson St
- 385-387 Jackson St
- 616 S Grant Ave Unit 3B
- 707 Sycamore Place Unit 707
- 517 Forest St
- 639 S Grant Ave
- 751 Wager St
- 626 Jaeger St Unit 7
- 676 Wager St
- 320 E Columbus St
- 279-281 E Beck St
- 432 E Kossuth St
- 308 Jackson St
- 242 E Sycamore St
- 497 E Kossuth St
- 841 Ann St
- 253 E Kossuth St Unit 253-H
- 472 E Whittier St
- 827 S 17th St
- 668 S 9th St
- 675 Beech St Unit 677
- 675 Beech St Unit 675-677
- 682 S 9th St
- 669 Beech St
- 664 S 9th St Unit 666
- 664 S 9th St
- 686 S 9th St
- 450 Elsmere St
- 661 Beech St Unit 663
- 663 Beech St
- 452 Elsmere St
- 654 S 9th St
- 659 Beech St
- 454 Elsmere St
- 694 S 9th St
- 456 Elsmere St
- 455 E Beck St
- 447 Elsmere St Unit 49
- 447-449 Elsmere St
Your Personal Tour Guide
Ask me questions while you tour the home.