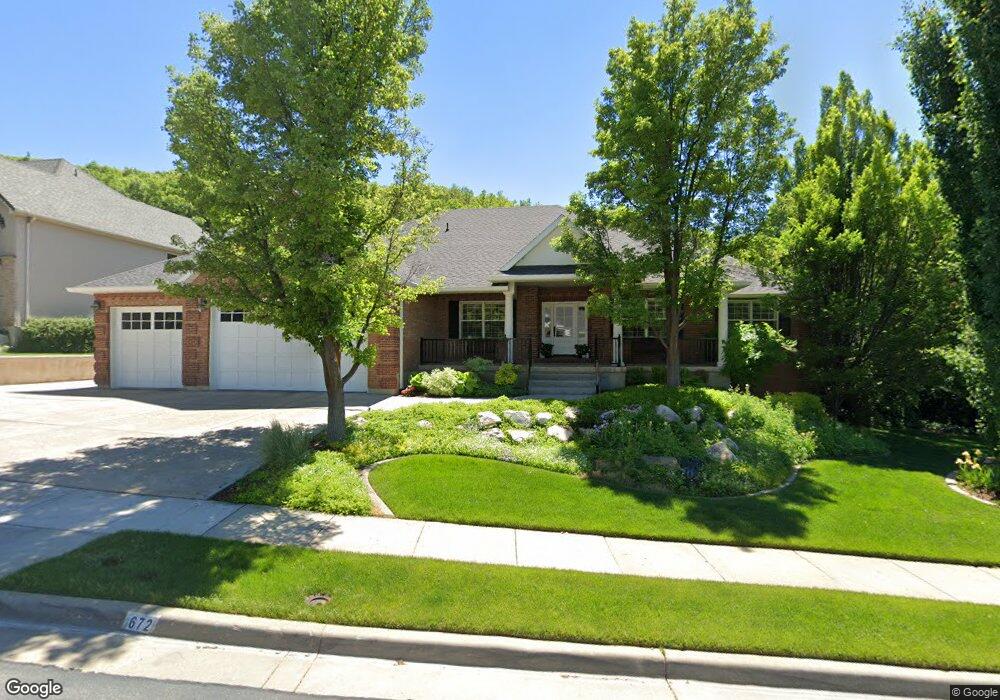
672 S Wood Briar Way North Salt Lake, UT 84054
Estimated Value: $1,132,000 - $1,324,000
6
Beds
4
Baths
6,216
Sq Ft
$199/Sq Ft
Est. Value
About This Home
This home is located at 672 S Wood Briar Way, North Salt Lake, UT 84054 and is currently estimated at $1,234,537, approximately $198 per square foot. 672 S Wood Briar Way is a home located in Davis County with nearby schools including Orchard School, South Davis Junior High School, and Woods Cross High School.
Ownership History
Date
Name
Owned For
Owner Type
Purchase Details
Closed on
Aug 8, 2001
Sold by
Allman Jerry T and Allman Sheryl A
Bought by
Pead W Gene and Pead Julie A
Current Estimated Value
Home Financials for this Owner
Home Financials are based on the most recent Mortgage that was taken out on this home.
Original Mortgage
$481,500
Outstanding Balance
$185,288
Interest Rate
7.12%
Estimated Equity
$1,049,249
Purchase Details
Closed on
Dec 18, 1996
Sold by
Allman Jerry T and Allman Sheryl A
Bought by
Allman Jerry T and Allman Sheryl A
Home Financials for this Owner
Home Financials are based on the most recent Mortgage that was taken out on this home.
Original Mortgage
$207,000
Interest Rate
7.67%
Purchase Details
Closed on
Sep 26, 1996
Sold by
Allman Jerry T
Bought by
Allman Jerry T and Allman Sheryl A
Purchase Details
Closed on
Jun 10, 1996
Sold by
Allman Jerry
Bought by
Allman Jerry T and Allman Sheryl A
Create a Home Valuation Report for This Property
The Home Valuation Report is an in-depth analysis detailing your home's value as well as a comparison with similar homes in the area
Home Values in the Area
Average Home Value in this Area
Purchase History
| Date | Buyer | Sale Price | Title Company |
|---|---|---|---|
| Pead W Gene | -- | Aspen Title Insurance Agency | |
| Allman Jerry T | -- | Associated Title Company | |
| Allman Jerry T | -- | Associated Title Company | |
| Allman Jerry T | -- | Associated Title Company | |
| Allman Jerry T | -- | -- |
Source: Public Records
Mortgage History
| Date | Status | Borrower | Loan Amount |
|---|---|---|---|
| Open | Pead W Gene | $481,500 | |
| Previous Owner | Allman Jerry T | $207,000 |
Source: Public Records
Tax History Compared to Growth
Tax History
| Year | Tax Paid | Tax Assessment Tax Assessment Total Assessment is a certain percentage of the fair market value that is determined by local assessors to be the total taxable value of land and additions on the property. | Land | Improvement |
|---|---|---|---|---|
| 2025 | $6,027 | $596,200 | $231,637 | $364,563 |
| 2024 | $5,643 | $567,600 | $219,172 | $348,428 |
| 2023 | $5,675 | $1,032,000 | $285,036 | $746,964 |
| 2022 | $5,598 | $558,800 | $155,681 | $403,119 |
| 2021 | $5,281 | $800,000 | $219,382 | $580,618 |
| 2020 | $4,685 | $702,000 | $209,060 | $492,940 |
| 2019 | $4,626 | $676,000 | $199,432 | $476,568 |
| 2018 | $4,407 | $637,000 | $178,210 | $458,790 |
| 2016 | $4,460 | $342,815 | $101,358 | $241,457 |
| 2015 | $4,543 | $335,500 | $101,358 | $234,142 |
| 2014 | $5,375 | $404,636 | $101,358 | $303,278 |
| 2013 | -- | $363,692 | $105,447 | $258,245 |
Source: Public Records
Map
Nearby Homes
- 568 S Tanglewood Loop Unit 1328
- 565 S Tanglewood Loop Unit 1325
- 566 S Tanglewood Loop Unit 1327
- 275 Eagle Way
- 720 Freedom Cir
- 690 Freedom Dr
- 285 Constitution Way
- 1045 Plum Tree Ct Unit 4B
- 151 S Bernice Way
- 3975 S Monarch Dr E
- 12 S Angela Way
- 585 Marialana Way
- 53 N Foxhill Rd
- 311 Edgemont Dr
- 755 Parkway Dr
- 683 Hillside Oak Cir
- 520 Lacey Way
- 928 S Pace Place
- 271 E Eagle Ridge Dr
- 789 Miller Ave
- 682 Woodbriar Way
- 664 Woodbriar Way
- 664 Wood Briar Way
- 665 Wood Briar Way
- 682 Wood Briar Way
- 673 Wood Briar Way
- 692 Woodbriar Way
- 692 S Wood Briar Way
- 647 Wood Briar Way
- 650 Wood Briar Way
- 647 Woodbriar Way
- 634 Sego Lily Cir
- 1095 Mariwood Cir
- 659 Wildflower Cir
- 637 Sego Lily Cir
- 702 Woodbriar Way
- 702 S Wood Briar Way
- 667 Wildflower Cir
- 1105 Mariwood Cir Unit 312
- 1105 Mariwood Cir