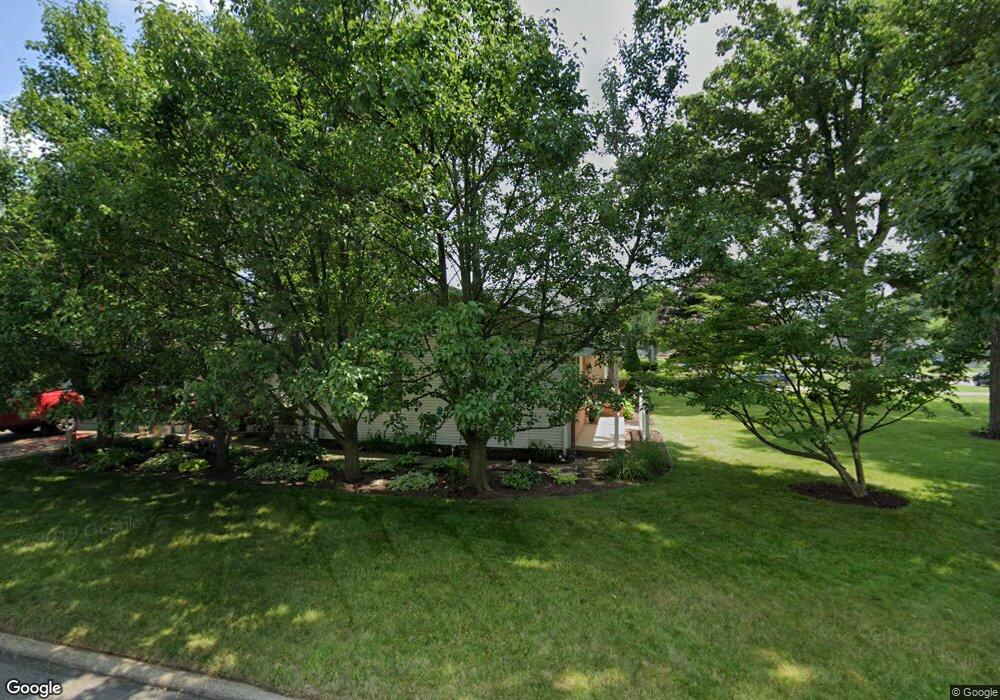
672 W Cook Rd Mansfield, OH 44907
Estimated Value: $195,000 - $223,000
5
Beds
1
Bath
1,564
Sq Ft
$132/Sq Ft
Est. Value
About This Home
This home is located at 672 W Cook Rd, Mansfield, OH 44907 and is currently estimated at $205,898, approximately $131 per square foot. 672 W Cook Rd is a home located in Richland County with nearby schools including Mansfield Christian School, Discovery School, and Mansfield Seventh-day Adventist School.
Ownership History
Date
Name
Owned For
Owner Type
Purchase Details
Closed on
Jun 4, 1996
Sold by
Hunter Helen
Bought by
Johnson Sharon L
Current Estimated Value
Home Financials for this Owner
Home Financials are based on the most recent Mortgage that was taken out on this home.
Original Mortgage
$70,200
Outstanding Balance
$1,524
Interest Rate
7.99%
Mortgage Type
New Conventional
Estimated Equity
$204,374
Purchase Details
Closed on
Feb 28, 1991
Sold by
Hunter Helen
Bought by
Hunter Helen
Create a Home Valuation Report for This Property
The Home Valuation Report is an in-depth analysis detailing your home's value as well as a comparison with similar homes in the area
Home Values in the Area
Average Home Value in this Area
Purchase History
| Date | Buyer | Sale Price | Title Company |
|---|---|---|---|
| Johnson Sharon L | $78,000 | -- | |
| Hunter Helen | -- | -- |
Source: Public Records
Mortgage History
| Date | Status | Borrower | Loan Amount |
|---|---|---|---|
| Open | Johnson Sharon L | $70,200 |
Source: Public Records
Tax History
| Year | Tax Paid | Tax Assessment Tax Assessment Total Assessment is a certain percentage of the fair market value that is determined by local assessors to be the total taxable value of land and additions on the property. | Land | Improvement |
|---|---|---|---|---|
| 2025 | $1,750 | $48,550 | $10,070 | $38,480 |
| 2024 | $1,750 | $48,550 | $10,070 | $38,480 |
| 2023 | $1,816 | $48,550 | $10,070 | $38,480 |
| 2022 | $1,728 | $39,640 | $8,570 | $31,070 |
| 2021 | $2,232 | $39,640 | $8,570 | $31,070 |
| 2020 | $2,283 | $39,640 | $8,570 | $31,070 |
| 2019 | $2,158 | $33,810 | $7,260 | $26,550 |
| 2018 | $2,128 | $33,810 | $7,260 | $26,550 |
| 2017 | $2,071 | $33,810 | $7,260 | $26,550 |
| 2016 | $2,140 | $33,880 | $7,050 | $26,830 |
| 2015 | $2,045 | $33,880 | $7,050 | $26,830 |
| 2014 | $2,018 | $33,880 | $7,050 | $26,830 |
| 2012 | $793 | $34,920 | $7,260 | $27,660 |
Source: Public Records
Map
Nearby Homes
- 986 Woodland Rd
- 554 W Cook Rd
- 945 Dickson Pkwy
- 889 Andover Rd
- 545 Stewart Ln
- 735 Courtwright Blvd
- 810 Lexington Ave
- 755 Locust Ln
- 489 Clifton Blvd
- 0 George Ave
- 655 Woodhill Rd
- 664 Woodhill Rd
- 710 Lexington Ave
- 210 Whippoorwill Ln
- 0 Bally Row Unit Lot 22930 223011207
- 0 Bally Row Unit Lot 22929 223011206
- 0 Bally Row Unit Lot 22940 223011208
- 1325 S Trimble Rd
- 1327 S Trimble Rd
- 575 Crescent Rd
Your Personal Tour Guide
Ask me questions while you tour the home.