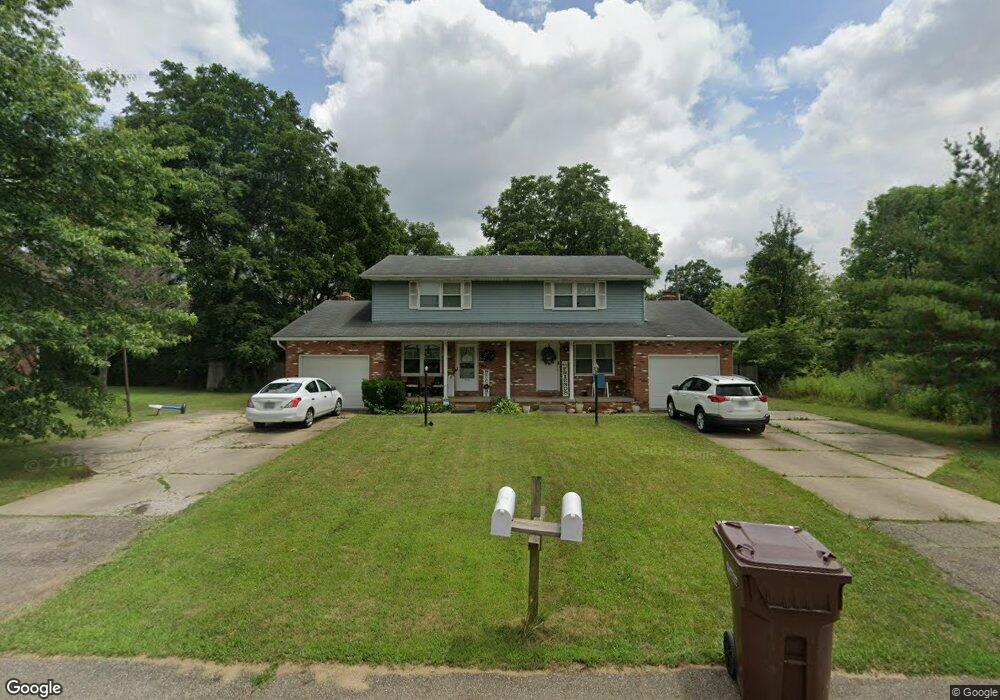
6720 Stream Ave NE Canton, OH 44721
Estimated Value: $244,000 - $287,000
4
Beds
4
Baths
2,448
Sq Ft
$111/Sq Ft
Est. Value
About This Home
This home is located at 6720 Stream Ave NE, Canton, OH 44721 and is currently estimated at $270,897, approximately $110 per square foot. 6720 Stream Ave NE is a home located in Stark County with nearby schools including Middlebranch Elementary School, Oakwood Middle School, and GlenOak High School.
Ownership History
Date
Name
Owned For
Owner Type
Purchase Details
Closed on
Aug 4, 2005
Sold by
Homecomings Financial Network Inc
Bought by
Vesely Michael J
Current Estimated Value
Home Financials for this Owner
Home Financials are based on the most recent Mortgage that was taken out on this home.
Original Mortgage
$116,400
Outstanding Balance
$62,048
Interest Rate
5.89%
Mortgage Type
Fannie Mae Freddie Mac
Estimated Equity
$208,849
Purchase Details
Closed on
Mar 23, 2005
Sold by
Sturznickel James A
Bought by
Homecomings Financial Network
Purchase Details
Closed on
Feb 1, 2001
Sold by
Tarzan John G
Bought by
Sturznickel James A
Home Financials for this Owner
Home Financials are based on the most recent Mortgage that was taken out on this home.
Original Mortgage
$133,340
Interest Rate
7.22%
Mortgage Type
Purchase Money Mortgage
Create a Home Valuation Report for This Property
The Home Valuation Report is an in-depth analysis detailing your home's value as well as a comparison with similar homes in the area
Home Values in the Area
Average Home Value in this Area
Purchase History
| Date | Buyer | Sale Price | Title Company |
|---|---|---|---|
| Vesely Michael J | $145,500 | Magee Title Agency | |
| Homecomings Financial Network | $150,000 | -- | |
| Sturznickel James A | $143,000 | First Service Title Agency I |
Source: Public Records
Mortgage History
| Date | Status | Borrower | Loan Amount |
|---|---|---|---|
| Open | Vesely Michael J | $116,400 | |
| Previous Owner | Sturznickel James A | $133,340 | |
| Closed | Sturznickel James A | $14,300 |
Source: Public Records
Tax History Compared to Growth
Tax History
| Year | Tax Paid | Tax Assessment Tax Assessment Total Assessment is a certain percentage of the fair market value that is determined by local assessors to be the total taxable value of land and additions on the property. | Land | Improvement |
|---|---|---|---|---|
| 2025 | -- | $69,060 | $22,440 | $46,620 |
| 2024 | -- | $69,060 | $22,440 | $46,620 |
| 2023 | $2,552 | $53,560 | $12,570 | $40,990 |
| 2022 | $2,564 | $53,560 | $12,570 | $40,990 |
| 2021 | $2,576 | $53,560 | $12,570 | $40,990 |
| 2020 | $2,479 | $46,840 | $10,820 | $36,020 |
| 2019 | $2,454 | $46,840 | $10,820 | $36,020 |
| 2018 | $2,432 | $46,840 | $10,820 | $36,020 |
| 2017 | $2,488 | $44,000 | $10,540 | $33,460 |
| 2016 | $2,494 | $44,000 | $10,540 | $33,460 |
| 2015 | $2,413 | $44,000 | $10,540 | $33,460 |
| 2014 | $610 | $46,520 | $9,730 | $36,790 |
| 2013 | $1,274 | $46,520 | $9,730 | $36,790 |
Source: Public Records
Map
Nearby Homes
- 6807 Sun Valley Ave NE
- 6731 Amsel Ave NE
- 6666 Carriage Lane Ave NE
- 6930 Firestone Rd NE
- 7192 Middlebranch Ave NE
- 6402 Blossomwood Cir NE
- 6880 Birchbark Ave NE
- 7023 Chatfield Ave NE
- 1847 Woodthrush St NE
- 7431 Middlebranch Ave NE
- 6473 Saint Leger Ave NE
- 6090 Wiclif St NE
- 7099 Fenwick Ave NE
- 6684 Leestone Ave NE
- 6533 Pine Bluff Ave NE
- 1614 Bellview St NE
- 2955 Chaucer Dr NE
- 6914 Stonecreek Ave NE
- 1544 Gate House St NE
- 1524 Eagle Watch St NE
- 6734 Stream Ave NE
- 6705 Middlebranch Ave NE
- 6758 Stream Ave NE
- 6731 Stream Ave NE
- 6744 Middlebranch Ave NE
- 6705 Stream Ave NE
- 0 Aspen St NE Unit 1108063
- 0 Aspen St NE Unit 4441420
- 6681 Middlebranch Ave NE
- 6746 Middlebranch Ave NE
- 6738 Middlebranch Ave NE
- 6698 Middlebranch Ave NE
- 6732 Sun Valley Ave NE
- 6750 Sun Valley Ave NE
- 2485 Aspen St NE
- 6766 Sun Valley Ave NE
- 6688 Middlebranch Ave NE
- 6655 Middlebranch Ave NE
- 6730 Sun Valley Ave NE
- 2465 Aspen St NE