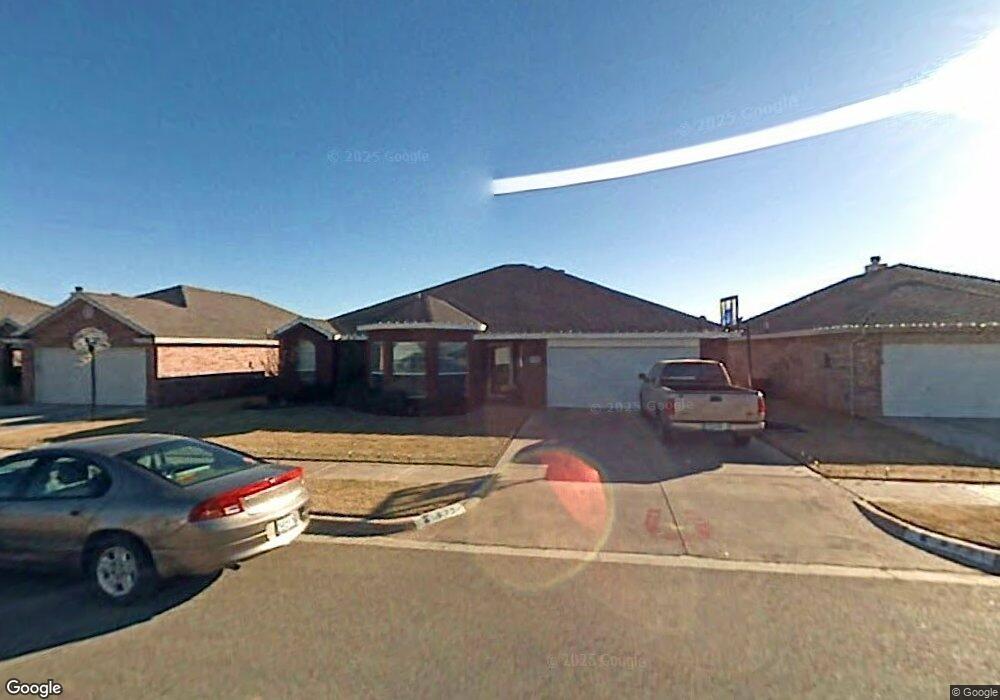
6721 87th St Lubbock, TX 79424
South West Lubbock NeighborhoodEstimated Value: $285,000 - $287,000
4
Beds
2
Baths
2,473
Sq Ft
$116/Sq Ft
Est. Value
About This Home
This home is located at 6721 87th St, Lubbock, TX 79424 and is currently estimated at $286,321, approximately $115 per square foot. 6721 87th St is a home located in Lubbock County with nearby schools including Oak Ridge Elementary School, Heritage Middle School, and Frenship High School.
Ownership History
Date
Name
Owned For
Owner Type
Purchase Details
Closed on
Aug 14, 2014
Sold by
Hogle Lance M and Hogle Johna V
Bought by
Phelps James
Current Estimated Value
Home Financials for this Owner
Home Financials are based on the most recent Mortgage that was taken out on this home.
Original Mortgage
$185,000
Outstanding Balance
$141,325
Interest Rate
4.16%
Mortgage Type
VA
Estimated Equity
$144,996
Purchase Details
Closed on
May 14, 2003
Sold by
Monterey I Ltd
Bought by
Phelps James
Purchase Details
Closed on
Apr 1, 2003
Sold by
Quality Land Devlpmnt Ltd
Bought by
Phelps James
Create a Home Valuation Report for This Property
The Home Valuation Report is an in-depth analysis detailing your home's value as well as a comparison with similar homes in the area
Home Values in the Area
Average Home Value in this Area
Purchase History
| Date | Buyer | Sale Price | Title Company |
|---|---|---|---|
| Phelps James | -- | Service Title | |
| Phelps James | -- | -- | |
| Phelps James | -- | -- |
Source: Public Records
Mortgage History
| Date | Status | Borrower | Loan Amount |
|---|---|---|---|
| Open | Phelps James | $185,000 |
Source: Public Records
Tax History
| Year | Tax Paid | Tax Assessment Tax Assessment Total Assessment is a certain percentage of the fair market value that is determined by local assessors to be the total taxable value of land and additions on the property. | Land | Improvement |
|---|---|---|---|---|
| 2025 | -- | $285,525 | $8,000 | $277,525 |
| 2024 | $58 | $282,184 | $8,000 | $274,184 |
| 2023 | $5,608 | $267,816 | $8,000 | $282,816 |
| 2022 | $5,543 | $243,469 | $8,000 | $247,665 |
| 2021 | $5,353 | $221,335 | $8,000 | $213,335 |
| 2020 | $4,984 | $205,131 | $8,000 | $197,131 |
| 2019 | $5,029 | $201,146 | $8,000 | $193,146 |
| 2018 | $4,971 | $198,612 | $8,000 | $190,612 |
| 2017 | $4,789 | $191,107 | $8,000 | $183,107 |
| 2016 | $4,677 | $186,655 | $8,000 | $178,655 |
| 2015 | $2,351 | $171,804 | $8,000 | $163,804 |
| 2014 | $2,351 | $161,093 | $8,000 | $153,093 |
Source: Public Records
Map
Nearby Homes
Your Personal Tour Guide
Ask me questions while you tour the home.