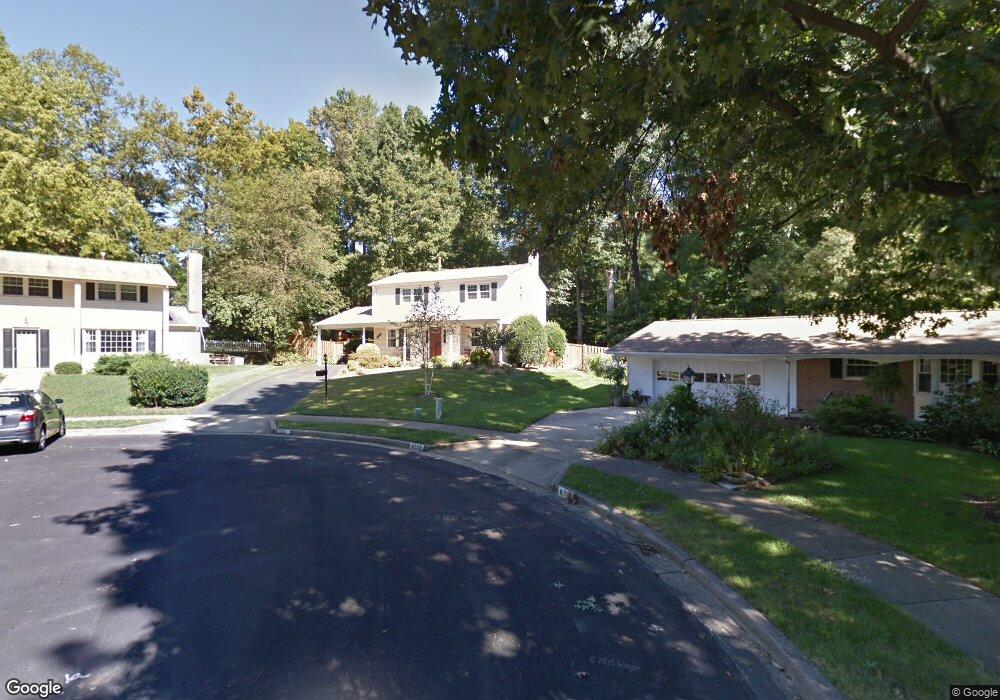
6721 Deborann Ct Springfield, VA 22152
Estimated Value: $771,000 - $799,000
4
Beds
3
Baths
1,464
Sq Ft
$538/Sq Ft
Est. Value
About This Home
This home is located at 6721 Deborann Ct, Springfield, VA 22152 and is currently estimated at $787,826, approximately $538 per square foot. 6721 Deborann Ct is a home located in Fairfax County with nearby schools including Orange Hunt Elementary School, Irving Middle School, and West Springfield High School.
Ownership History
Date
Name
Owned For
Owner Type
Purchase Details
Closed on
Jul 30, 2018
Sold by
Moss Jennie E
Bought by
Ford Elijah Clifford and Ford Jennifer Brenda
Current Estimated Value
Home Financials for this Owner
Home Financials are based on the most recent Mortgage that was taken out on this home.
Original Mortgage
$543,025
Outstanding Balance
$472,625
Interest Rate
4.6%
Mortgage Type
VA
Estimated Equity
$315,201
Purchase Details
Closed on
May 22, 2017
Sold by
Moss Jennie E and Waldron Johnathan L
Bought by
Moss Jennie E
Home Financials for this Owner
Home Financials are based on the most recent Mortgage that was taken out on this home.
Original Mortgage
$419,600
Interest Rate
4.03%
Mortgage Type
New Conventional
Purchase Details
Closed on
Jul 11, 2011
Sold by
Frio Francis A
Bought by
Moss Jennie E and Waldron Johnathan L
Home Financials for this Owner
Home Financials are based on the most recent Mortgage that was taken out on this home.
Original Mortgage
$453,212
Interest Rate
4.6%
Mortgage Type
FHA
Create a Home Valuation Report for This Property
The Home Valuation Report is an in-depth analysis detailing your home's value as well as a comparison with similar homes in the area
Home Values in the Area
Average Home Value in this Area
Purchase History
| Date | Buyer | Sale Price | Title Company |
|---|---|---|---|
| Ford Elijah Clifford | $575,000 | Ekko Title | |
| Moss Jennie E | -- | None Available | |
| Moss Jennie E | $465,000 | -- |
Source: Public Records
Mortgage History
| Date | Status | Borrower | Loan Amount |
|---|---|---|---|
| Open | Ford Elijah Clifford | $543,025 | |
| Previous Owner | Moss Jennie E | $419,600 | |
| Previous Owner | Moss Jennie E | $453,212 |
Source: Public Records
Tax History
| Year | Tax Paid | Tax Assessment Tax Assessment Total Assessment is a certain percentage of the fair market value that is determined by local assessors to be the total taxable value of land and additions on the property. | Land | Improvement |
|---|---|---|---|---|
| 2020 | $6,628 | $560,040 | $220,000 | $340,040 |
| 2019 | $6,616 | $559,020 | $215,000 | $344,020 |
| 2018 | $6,383 | $539,350 | $205,000 | $334,350 |
| 2017 | $5,963 | $513,580 | $200,000 | $313,580 |
| 2016 | $5,950 | $513,580 | $200,000 | $313,580 |
| 2015 | $5,732 | $513,580 | $200,000 | $313,580 |
| 2014 | $5,474 | $491,600 | $195,000 | $296,600 |
Source: Public Records
Map
Nearby Homes
- 8703 Etta Dr
- 6606 Huntsman Blvd
- 6607 Grey Fox Dr
- 6819 Lavant Dr
- 8615 Kerry Ln
- 6901 Huntsman Blvd
- 8600 Kentford Dr
- 6410 Wyngate Dr
- 8967 Omega Ct
- 8737 Sheridan Farms Ct
- 8826 Surveyors Place
- 8656 Tuttle Rd
- 7115 Hundsford Ln
- 9060 Blarney Stone Dr
- 9101 Old Keene Mill Rd
- 6515 Field Master Dr
- 6644 Green Ash Dr
- 6352 Shaundale Dr
- 6708 Portree Ct
- 7105 Galgate Dr
- 6720 Deborann Ct
- 6723 Deborann Ct
- 6709 Reynard Dr
- 6711 Reynard Dr
- 8706 Powder Horn Rd
- 6722 Deborann Ct
- 6707 Reynard Dr
- 6713 Reynard Dr
- 8712 Powder Horn Rd
- 8704 Powder Horn Rd
- 6705 Reynard Dr
- 6715 Reynard Dr
- 8709 Powder Horn Rd
- 8714 Powder Horn Rd
- 6723 Houndmaster Rd
- 8705 Powder Horn Rd
- 6703 Reynard Dr
- 8711 Powder Horn Rd
- 8702 Powder Horn Rd
- 6710 Reynard Dr
Your Personal Tour Guide
Ask me questions while you tour the home.