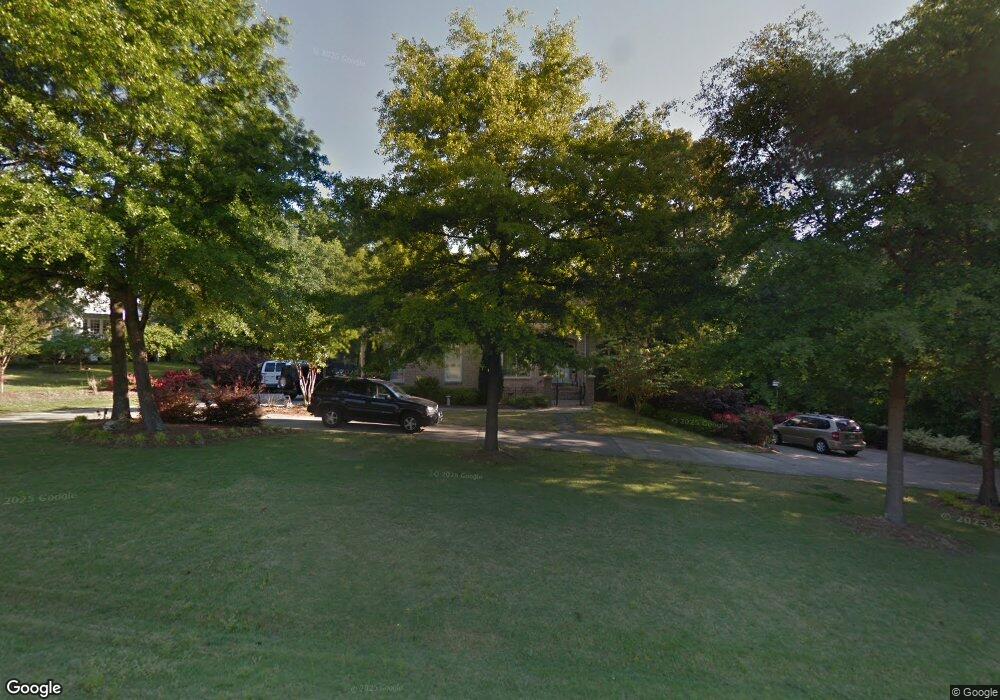
6721 Wavcott Dr Fuquay Varina, NC 27526
Estimated Value: $662,000 - $804,000
4
Beds
4
Baths
3,632
Sq Ft
$198/Sq Ft
Est. Value
About This Home
This home is located at 6721 Wavcott Dr, Fuquay Varina, NC 27526 and is currently estimated at $717,449, approximately $197 per square foot. 6721 Wavcott Dr is a home located in Wake County with nearby schools including Buckhorn Creek Elementary, Fuquay-Varina High, and Southern Wake Academy.
Ownership History
Date
Name
Owned For
Owner Type
Purchase Details
Closed on
Apr 19, 2007
Sold by
Spiers Donna R Buck and Spiers Donna Rene Buck
Bought by
Englert Frank Patrick and Englert Jill Ann
Current Estimated Value
Home Financials for this Owner
Home Financials are based on the most recent Mortgage that was taken out on this home.
Original Mortgage
$304,000
Outstanding Balance
$183,300
Interest Rate
6.1%
Mortgage Type
Purchase Money Mortgage
Estimated Equity
$534,149
Purchase Details
Closed on
Jan 10, 2001
Sold by
Elite Builders Inc
Bought by
Spiers Roger D and Spiers Donna R Buck
Home Financials for this Owner
Home Financials are based on the most recent Mortgage that was taken out on this home.
Original Mortgage
$248,000
Interest Rate
7.65%
Purchase Details
Closed on
Jun 1, 2000
Sold by
Akins Anna R
Bought by
Elite Builders Inc
Create a Home Valuation Report for This Property
The Home Valuation Report is an in-depth analysis detailing your home's value as well as a comparison with similar homes in the area
Home Values in the Area
Average Home Value in this Area
Purchase History
| Date | Buyer | Sale Price | Title Company |
|---|---|---|---|
| Englert Frank Patrick | $380,000 | None Available | |
| Spiers Roger D | $310,000 | -- | |
| Elite Builders Inc | $36,000 | -- |
Source: Public Records
Mortgage History
| Date | Status | Borrower | Loan Amount |
|---|---|---|---|
| Open | Englert Frank Patrick | $304,000 | |
| Previous Owner | Spiers Roger D | $248,000 | |
| Closed | Spiers Roger D | $46,500 |
Source: Public Records
Tax History Compared to Growth
Tax History
| Year | Tax Paid | Tax Assessment Tax Assessment Total Assessment is a certain percentage of the fair market value that is determined by local assessors to be the total taxable value of land and additions on the property. | Land | Improvement |
|---|---|---|---|---|
| 2025 | $3,586 | $557,603 | $120,000 | $437,603 |
| 2024 | $3,395 | $543,525 | $120,000 | $423,525 |
| 2023 | $3,485 | $444,384 | $44,000 | $400,384 |
| 2022 | $3,229 | $444,384 | $44,000 | $400,384 |
| 2021 | $3,143 | $444,384 | $44,000 | $400,384 |
| 2020 | $3,091 | $444,384 | $44,000 | $400,384 |
| 2019 | $3,266 | $397,509 | $44,000 | $353,509 |
| 2018 | $3,003 | $397,509 | $44,000 | $353,509 |
| 2017 | $2,846 | $397,509 | $44,000 | $353,509 |
| 2016 | $2,789 | $397,509 | $44,000 | $353,509 |
| 2015 | $2,873 | $410,820 | $54,000 | $356,820 |
| 2014 | $2,723 | $410,820 | $54,000 | $356,820 |
Source: Public Records
Map
Nearby Homes
- 545 Glenwyck Ct
- 605 Hampton Crest Ct
- Cooper Plan at Broadwell Trace - Broadwell Estates
- Cypress Plan at Broadwell Trace - Broadwell Estates
- 1528 Maelyn Way
- 1800 Phelps Rd W
- 1504 Maelyn Way
- 909 Wilbon Rd
- 701 Laurel Spring Dr
- 713 Laurel Spring Dr
- 975 Wilbon
- 1152 Summer Meadow Dr
- 6625 Maggiewood Ln
- 301 Brindle Dr
- 945 Wilbon Rd
- 885 Wilbon Rd
- 1114 Noor Ln
- 1108 Summer Meadow Dr
- 498 Walker Ranch Dr
- 809 Briar Gate Dr
- 6717 Wavcott Dr
- 6713 Wavcott Dr
- 6724 Wavcott Dr
- 5500 Aegis Ln
- 6712 Wavcott Dr
- 5505 Aegis Ln
- 5504 Aegis Ln
- 5509 Aegis Ln
- 6705 Wavcott Dr
- 5401 Mattwynd Ln
- 6704 Wavcott Dr
- 5405 Mattwynd Ln
- 5410 Mattwynd Ln
- 5400 Mattwynd Ln
- 6700 Wavcott Dr
- 5404 Mattwynd Ln
- 5408 Mattwynd Ln
- 6628 Wavcott Dr
- 5500 Furan Ct
- 6624 Wavcott Dr