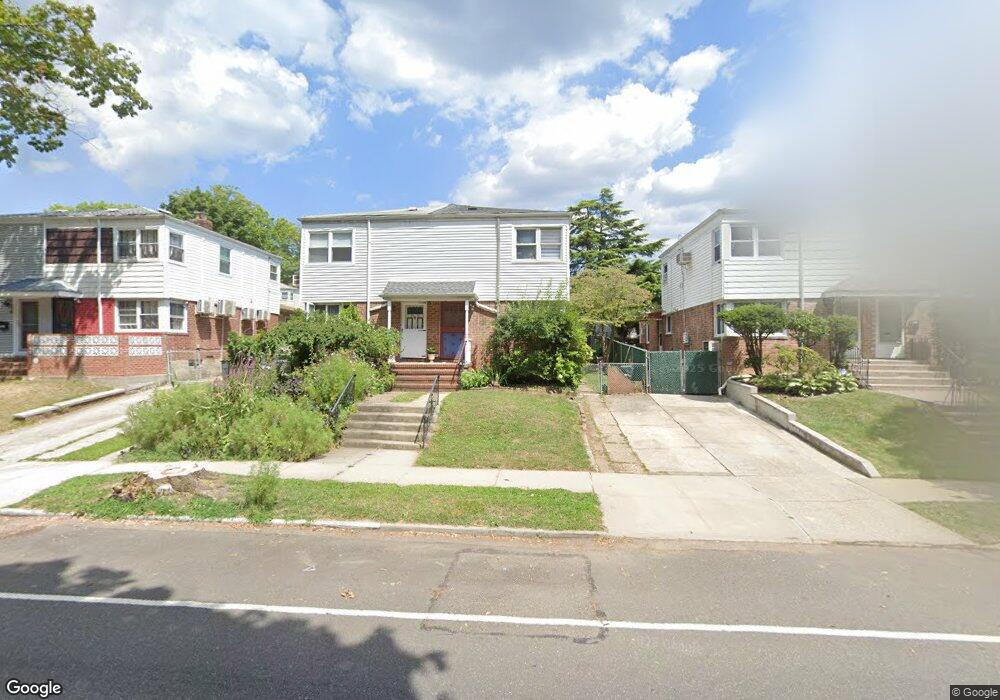
6723 210th St Oakland Gardens, NY 11364
Oakland Gardens NeighborhoodEstimated Value: $755,000 - $859,000
2
Beds
2
Baths
896
Sq Ft
$897/Sq Ft
Est. Value
About This Home
This home is located at 6723 210th St, Oakland Gardens, NY 11364 and is currently estimated at $804,085, approximately $897 per square foot. 6723 210th St is a home located in Queens County with nearby schools including P.S. 46 - Alley Pond, Nathaniel Hawthorne Middle School 74, and Benjamin N Cardozo High School.
Ownership History
Date
Name
Owned For
Owner Type
Purchase Details
Closed on
Dec 22, 2005
Sold by
Lam-Tan Soc Lay and Tan Chhuong Chen
Bought by
Cheung Pui Wah Wong and Wong Kin Loong
Current Estimated Value
Purchase Details
Closed on
Dec 4, 2003
Sold by
Brightman Ellen L Exec
Bought by
Lam-Tan Soc Lay and Tan Chhuong Chen
Home Financials for this Owner
Home Financials are based on the most recent Mortgage that was taken out on this home.
Original Mortgage
$280,000
Interest Rate
5.58%
Mortgage Type
Purchase Money Mortgage
Purchase Details
Closed on
Aug 25, 1997
Sold by
Greene Julia C
Bought by
Cheng Amy Shin Mei and Cheng Ming Kee
Home Financials for this Owner
Home Financials are based on the most recent Mortgage that was taken out on this home.
Original Mortgage
$120,000
Interest Rate
7.41%
Create a Home Valuation Report for This Property
The Home Valuation Report is an in-depth analysis detailing your home's value as well as a comparison with similar homes in the area
Home Values in the Area
Average Home Value in this Area
Purchase History
| Date | Buyer | Sale Price | Title Company |
|---|---|---|---|
| Cheung Pui Wah Wong | $465,000 | -- | |
| Lam-Tan Soc Lay | $375,000 | -- | |
| Cheng Amy Shin Mei | -- | -- |
Source: Public Records
Mortgage History
| Date | Status | Borrower | Loan Amount |
|---|---|---|---|
| Previous Owner | Lam-Tan Soc Lay | $280,000 | |
| Previous Owner | Cheng Amy Shin Mei | $120,000 |
Source: Public Records
Tax History Compared to Growth
Tax History
| Year | Tax Paid | Tax Assessment Tax Assessment Total Assessment is a certain percentage of the fair market value that is determined by local assessors to be the total taxable value of land and additions on the property. | Land | Improvement |
|---|---|---|---|---|
| 2025 | $2,696 | $39,564 | $12,697 | $26,867 |
| 2024 | $2,800 | $37,325 | $11,809 | $25,516 |
| 2023 | $2,546 | $35,831 | $11,482 | $24,349 |
| 2022 | $2,630 | $40,620 | $13,440 | $27,180 |
| 2021 | $2,715 | $43,020 | $13,440 | $29,580 |
| 2020 | $6,073 | $39,180 | $13,440 | $25,740 |
| 2019 | $5,611 | $40,200 | $13,440 | $26,760 |
| 2018 | $5,202 | $29,859 | $10,840 | $19,019 |
| 2017 | $5,435 | $29,859 | $12,095 | $17,764 |
| 2016 | $5,162 | $29,859 | $12,095 | $17,764 |
| 2015 | $3,178 | $27,475 | $13,207 | $14,268 |
| 2014 | $3,178 | $25,920 | $14,940 | $10,980 |
Source: Public Records
Map
Nearby Homes
- 67-29 211th St
- 67-52 212th St
- 210-12 69th Ave Unit Lower
- 211-8 69th Ave Unit 1A
- 69-27 210th St Unit 2
- 69-29 210th St Unit A
- 211-11 73rd Ave Unit B
- 64-16 211th St
- 211-19A 73rd Ave Unit Lower
- 212-12 73rd Ave Unit 5C
- 213-15 73rd Ave
- 213-15 73rd Ave Unit LOWER
- 64-07 213th St
- 64-58 215th St
- 73-23 210th St Unit 2G
- 213-25 73rd Ave Unit B
- 67-10 Bell Blvd
- 69-09 215th St Unit 1
- 69-09 215th St Unit Lower 1
- 64-47 215 St