Estimated Value: $925,000 - $995,000
3
Beds
4
Baths
3,911
Sq Ft
$246/Sq Ft
Est. Value
About This Home
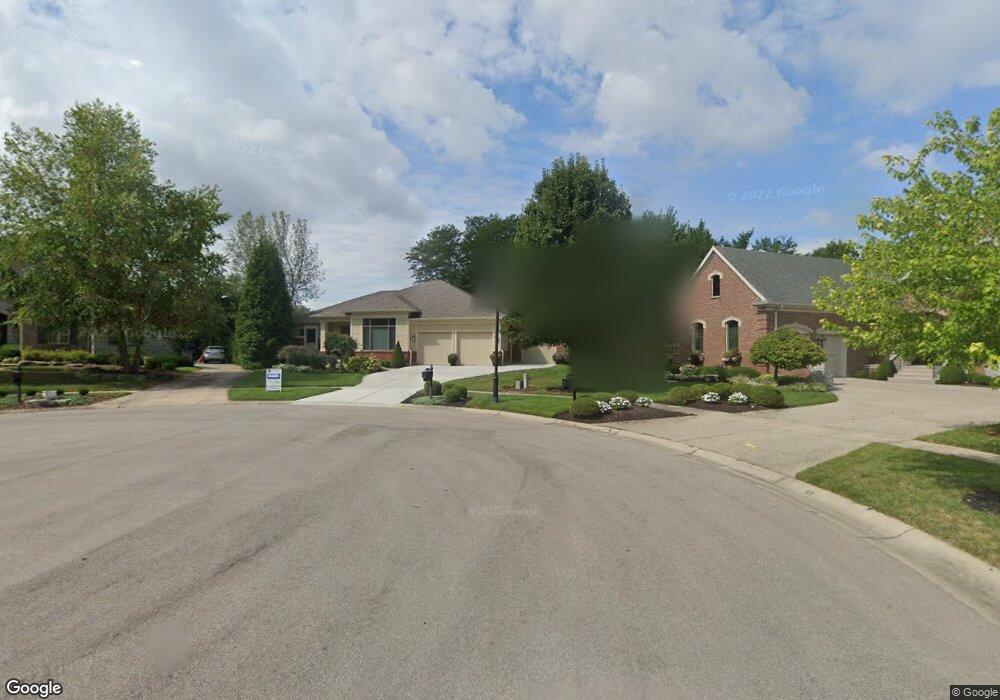
This home is located at 6723 Sherbourne Ct Unit 82, Mason, OH 45040 and is currently estimated at $963,093, approximately $246 per square foot. 6723 Sherbourne Ct Unit 82 is a home located in Warren County with nearby schools including Mason Intermediate Elementary School, Mason Middle School, and William Mason High School.
Ownership History
Date
Name
Owned For
Owner Type
Purchase Details
Closed on
Oct 14, 2022
Sold by
Conklin Rolland W and Conklin Karen E
Bought by
Tracy Josh and Tracy Rachel
Current Estimated Value
Home Financials for this Owner
Home Financials are based on the most recent Mortgage that was taken out on this home.
Original Mortgage
$470,000
Outstanding Balance
$444,905
Interest Rate
4%
Mortgage Type
New Conventional
Estimated Equity
$518,188
Purchase Details
Closed on
Feb 1, 2010
Sold by
Planned Development Company Of Ohio
Bought by
Conklin Rolland W and Conklin Karen E
Purchase Details
Closed on
May 15, 2002
Sold by
Vent Hines Griffin Joint
Bought by
Kurlemann Bldrs Inc
Home Financials for this Owner
Home Financials are based on the most recent Mortgage that was taken out on this home.
Original Mortgage
$1,840,000
Interest Rate
7.16%
Mortgage Type
New Conventional
Create a Home Valuation Report for This Property
The Home Valuation Report is an in-depth analysis detailing your home's value as well as a comparison with similar homes in the area
Home Values in the Area
Average Home Value in this Area
Purchase History
| Date | Buyer | Sale Price | Title Company |
|---|---|---|---|
| Tracy Josh | $825,000 | -- | |
| Conklin Rolland W | $110,000 | First Title Agency | |
| Kurlemann Bldrs Inc | $1,833,000 | -- |
Source: Public Records
Mortgage History
| Date | Status | Borrower | Loan Amount |
|---|---|---|---|
| Open | Tracy Josh | $470,000 | |
| Previous Owner | Kurlemann Bldrs Inc | $1,840,000 |
Source: Public Records
Tax History Compared to Growth
Tax History
| Year | Tax Paid | Tax Assessment Tax Assessment Total Assessment is a certain percentage of the fair market value that is determined by local assessors to be the total taxable value of land and additions on the property. | Land | Improvement |
|---|---|---|---|---|
| 2024 | $11,082 | $255,080 | $47,250 | $207,830 |
| 2023 | $10,696 | $202,772 | $48,667 | $154,105 |
| 2022 | $10,514 | $202,773 | $48,668 | $154,105 |
| 2021 | $10,009 | $202,773 | $48,668 | $154,105 |
| 2020 | $11,410 | $196,868 | $47,250 | $149,618 |
| 2019 | $10,585 | $196,868 | $47,250 | $149,618 |
| 2018 | $10,396 | $196,868 | $47,250 | $149,618 |
| 2017 | $10,794 | $184,524 | $41,475 | $143,049 |
| 2016 | $10,986 | $184,524 | $41,475 | $143,049 |
| 2015 | $10,887 | $184,524 | $41,475 | $143,049 |
| 2014 | $11,225 | $175,740 | $39,500 | $136,240 |
| 2013 | $11,249 | $210,210 | $47,250 | $162,960 |
Source: Public Records
Map
Nearby Homes
- 6826 Waterbury Ln
- 4669 Morris Ct
- 4109 Maxwell Dr
- 8256 Cherry Laurel Dr
- 5017 Ainsley Dr
- 6577 Rosegate Ct
- 4253 Maxwell Dr
- 7112 Larkspur Ln
- 5088 Harvestdale Dr
- 5280 Sunset Ridge Dr
- 6525 Rosewood Ln
- 4029 Ivygrove Ln
- 4164 Melampy Creek Ln
- 4576 Meadowbrook Ln
- 4319 Serpentine Way
- 8319 Verbena Ln
- 3923 Marquis Ln
- 3852 Legacy Dr
- 6723 Sherbourne Ct
- 6717 Sherbourne Ct
- 6720 Sherbourne Ct
- 4766 Hampton Village Dr
- 4769 Hampton Village Dr
- 6716 Sherbourne Ct Unit 80
- 6716 Sherbourne Ct
- 6713 Sherbourne Ct
- 6710 Sherbourne Ct
- 4768 Hampton Village Dr
- 6722 Heritage Woods Dr Unit 8
- 6722 Heritage Woods Dr
- 6810 Heritage Club Dr
- 4781 Hampton Village Dr
- 6689 Sherbourne Ct
- 6686 Heritage Woods Dr
- 6694 Sherbourne Ct Unit 78
- 6694 Sherbourne Ct
- 6792 Heritage Club Dr
- 4780 Hampton Village Dr