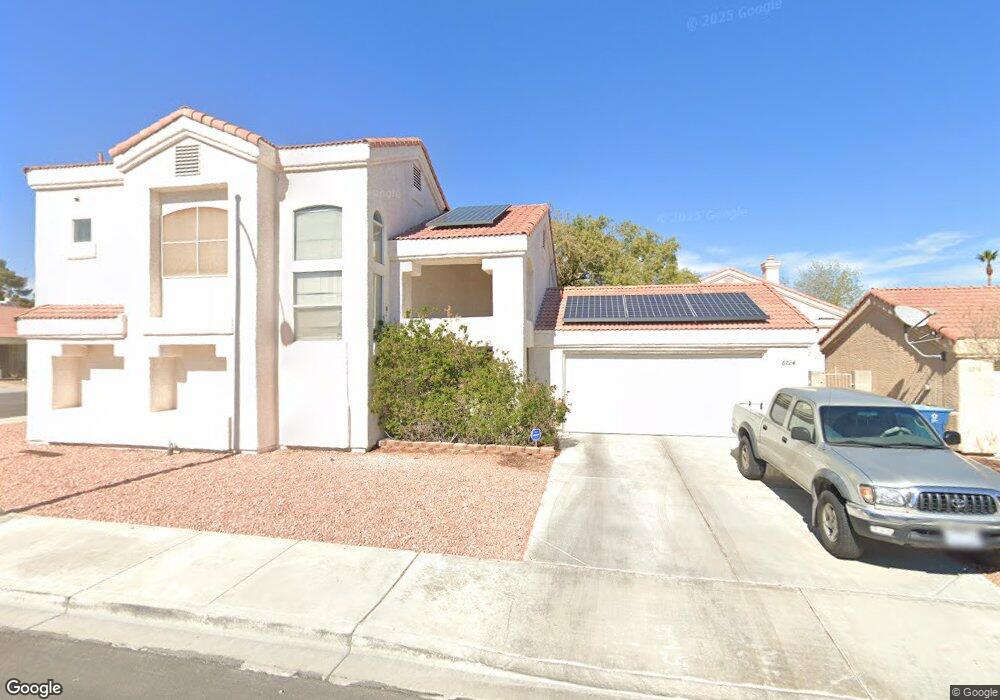
6724 Old Newbury Ave Unit III Las Vegas, NV 89108
Michael Way NeighborhoodEstimated Value: $349,000 - $395,000
3
Beds
3
Baths
1,452
Sq Ft
$258/Sq Ft
Est. Value
About This Home
This home is located at 6724 Old Newbury Ave Unit III, Las Vegas, NV 89108 and is currently estimated at $374,054, approximately $257 per square foot. 6724 Old Newbury Ave Unit III is a home located in Clark County with nearby schools including Berkeley L. Bunker Elementary School, Irwin & Susan Molasky Junior High School, and Cimarron Memorial High School.
Ownership History
Date
Name
Owned For
Owner Type
Purchase Details
Closed on
Aug 15, 2019
Sold by
Selander Robert R
Bought by
Plum John D
Current Estimated Value
Purchase Details
Closed on
Oct 14, 2016
Sold by
Plum John D
Bought by
Plum John D and Selander Robert R
Home Financials for this Owner
Home Financials are based on the most recent Mortgage that was taken out on this home.
Original Mortgage
$135,000
Interest Rate
3.44%
Mortgage Type
New Conventional
Purchase Details
Closed on
Mar 5, 2002
Sold by
Mamiya Paul H
Bought by
Plum John D
Home Financials for this Owner
Home Financials are based on the most recent Mortgage that was taken out on this home.
Original Mortgage
$137,738
Interest Rate
6.99%
Mortgage Type
FHA
Create a Home Valuation Report for This Property
The Home Valuation Report is an in-depth analysis detailing your home's value as well as a comparison with similar homes in the area
Home Values in the Area
Average Home Value in this Area
Purchase History
| Date | Buyer | Sale Price | Title Company |
|---|---|---|---|
| Plum John D | -- | None Available | |
| Plum John D | -- | Title Source Inc | |
| Plum John D | $139,900 | Fidelity National Title |
Source: Public Records
Mortgage History
| Date | Status | Borrower | Loan Amount |
|---|---|---|---|
| Previous Owner | Plum John D | $135,000 | |
| Previous Owner | Plum John D | $137,738 |
Source: Public Records
Tax History Compared to Growth
Tax History
| Year | Tax Paid | Tax Assessment Tax Assessment Total Assessment is a certain percentage of the fair market value that is determined by local assessors to be the total taxable value of land and additions on the property. | Land | Improvement |
|---|---|---|---|---|
| 2025 | $1,559 | $68,729 | $26,250 | $42,479 |
| 2024 | $1,444 | $68,729 | $26,250 | $42,479 |
| 2023 | $1,444 | $67,424 | $26,600 | $40,824 |
| 2022 | $1,338 | $59,224 | $21,700 | $37,524 |
| 2021 | $1,239 | $56,272 | $20,300 | $35,972 |
| 2020 | $1,147 | $55,475 | $19,600 | $35,875 |
| 2019 | $1,075 | $52,397 | $16,800 | $35,597 |
| 2018 | $1,026 | $47,576 | $13,300 | $34,276 |
| 2017 | $962 | $47,439 | $12,600 | $34,839 |
| 2016 | $962 | $46,185 | $10,850 | $35,335 |
| 2015 | $959 | $40,284 | $7,000 | $33,284 |
| 2014 | $931 | $27,543 | $5,600 | $21,943 |
Source: Public Records
Map
Nearby Homes
- 6612 Old Newbury Ave
- 2801 N Rainbow Blvd Unit 103
- 2801 N Rainbow Blvd Unit 273
- 2801 N Rainbow Blvd Unit 252
- 2801 N Rainbow Blvd Unit 112
- 6673 Silver Penny Ave
- 6544 Old Oxford Ave
- 2700 N Rainbow Blvd Unit 1105
- 2700 N Rainbow Blvd Unit 1137
- 6612 Gentle Winds Ct
- 6632 Light Breeze Dr
- 6536 Castor Tree Way
- 2764 Trotwood Ln
- 6632 Coastal Breeze Ct
- 3100 Garehime St
- 6561 Avon Ct
- 6428 Yarmouth Dr
- 2532 Goldenmoon St
- 2912 Drury St
- 2528 Cherrywood St
- 6716 Old Newbury Ave Unit III
- 6725 Silvery Ave
- 6721 Silvery Ave
- 2813 Du Barry Manor Ln
- 2813 Du Barry Manor Ln Unit SFR
- 2817 Du Barry Manor Ln
- 6725 Old Newbury Ave
- 6721 Old Newbury Ave
- 6712 Old Newbury Ave
- 2821 Du Barry Manor Ln Unit III
- 6717 Old Newbury Ave
- 6713 Silvery Ave
- 6713 Old Newbury Ave
- 2825 Du Barry Manor Ln
- 2805 Du Barry Manor Ln
- 2805 Du Barry Manor Ln
- 2805 Du Barry Manor Ln
- 2805 Du Barry Manor Ln Unit na
- 6709 Silvery Ave
- 6724 Silver Spoon Dr