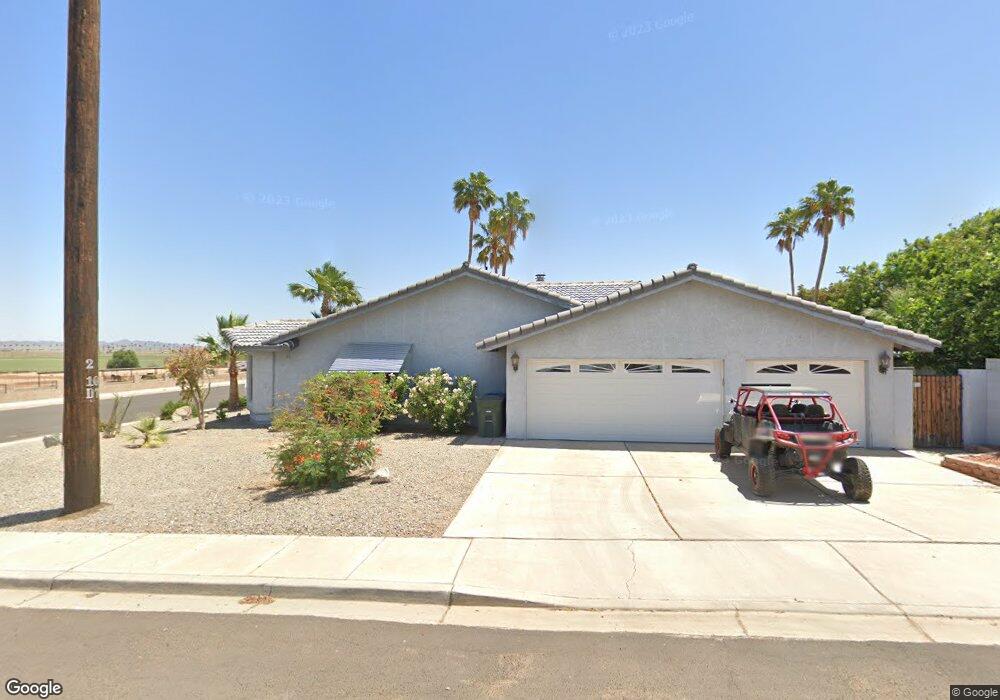
6725 E Mountain View Place Yuma, AZ 85365
Cresta Gila Estates NeighborhoodEstimated Value: $505,641 - $616,000
3
Beds
2
Baths
2,300
Sq Ft
$247/Sq Ft
Est. Value
About This Home
This home is located at 6725 E Mountain View Place, Yuma, AZ 85365 and is currently estimated at $567,410, approximately $246 per square foot. 6725 E Mountain View Place is a home located in Yuma County with nearby schools including Desert Mesa Elementary School, Castle Dome Middle School, and Gila Ridge High School.
Ownership History
Date
Name
Owned For
Owner Type
Purchase Details
Closed on
Jun 30, 2016
Sold by
Lester B B and Lester Jarrett L
Bought by
Purcell Darrell R
Current Estimated Value
Home Financials for this Owner
Home Financials are based on the most recent Mortgage that was taken out on this home.
Original Mortgage
$275,000
Outstanding Balance
$217,153
Interest Rate
3.58%
Mortgage Type
VA
Estimated Equity
$350,257
Purchase Details
Closed on
Jun 12, 2007
Sold by
Massey Jarrett L
Bought by
Massey Lester B and Massey Jarrett L
Purchase Details
Closed on
May 22, 2007
Sold by
Massey Lester B and Massey Jarrett L
Bought by
Massey Jarrett L
Purchase Details
Closed on
Sep 19, 2006
Sold by
Massey Jarrett L
Bought by
Massey Lester B and Massey Jarret L
Purchase Details
Closed on
Apr 7, 2006
Sold by
Massey Lester
Bought by
Massey Jarrett L
Home Financials for this Owner
Home Financials are based on the most recent Mortgage that was taken out on this home.
Original Mortgage
$326,250
Interest Rate
6.29%
Mortgage Type
Fannie Mae Freddie Mac
Create a Home Valuation Report for This Property
The Home Valuation Report is an in-depth analysis detailing your home's value as well as a comparison with similar homes in the area
Home Values in the Area
Average Home Value in this Area
Purchase History
| Date | Buyer | Sale Price | Title Company |
|---|---|---|---|
| Purcell Darrell R | -- | Chicago Title Company | |
| Massey Lester B | -- | Citizens Title | |
| Massey Jarrett L | -- | Citizens Title | |
| Massey Jarrett L | -- | Citizens Title | |
| Massey Lester B | -- | Yuma Title | |
| Massey Jarrett L | -- | Yuma Title | |
| Massey Jarrett L | $362,500 | Yuma Title |
Source: Public Records
Mortgage History
| Date | Status | Borrower | Loan Amount |
|---|---|---|---|
| Open | Purcell Darrell R | $275,000 | |
| Previous Owner | Massey Jarrett L | $326,250 |
Source: Public Records
Tax History
| Year | Tax Paid | Tax Assessment Tax Assessment Total Assessment is a certain percentage of the fair market value that is determined by local assessors to be the total taxable value of land and additions on the property. | Land | Improvement |
|---|---|---|---|---|
| 2025 | $3,603 | $34,690 | $6,328 | $28,362 |
| 2024 | $3,415 | $33,038 | $5,859 | $27,179 |
| 2023 | $3,415 | $31,464 | $6,542 | $24,922 |
| 2022 | $3,296 | $29,966 | $6,162 | $23,804 |
| 2021 | $3,498 | $28,540 | $5,883 | $22,657 |
| 2020 | $3,196 | $27,180 | $6,200 | $20,980 |
| 2019 | $3,303 | $27,251 | $5,589 | $21,662 |
| 2018 | $3,140 | $25,953 | $5,735 | $20,218 |
| 2017 | $3,005 | $25,953 | $5,735 | $20,218 |
| 2016 | $3,069 | $24,612 | $6,450 | $18,162 |
| 2015 | $2,543 | $23,540 | $5,680 | $17,860 |
| 2014 | $2,543 | $22,419 | $6,000 | $16,419 |
Source: Public Records
Map
Nearby Homes
- 6739 E Mountain View Place
- 6720 E Mission St
- 6734 E Mission St
- 6753 E Mountain View Place
- 6746 E Mission St
- 6682 E Mountain View Place
- 6684 E Mission St
- 6758 E Mission St
- 6670 E Mountain View Place
- 6721 E Mission St
- 6735 E Mission St
- 6672 E Mission St
- 6697 E Mission St
- 6749 E Mission St
- 6656 E Mountain View Place
- 6685 E Mission St
- 6781 E Mountain View Place
- 6763 E Mission St
- 6658 E Mission St
- 6673 E Mission St
Your Personal Tour Guide
Ask me questions while you tour the home.