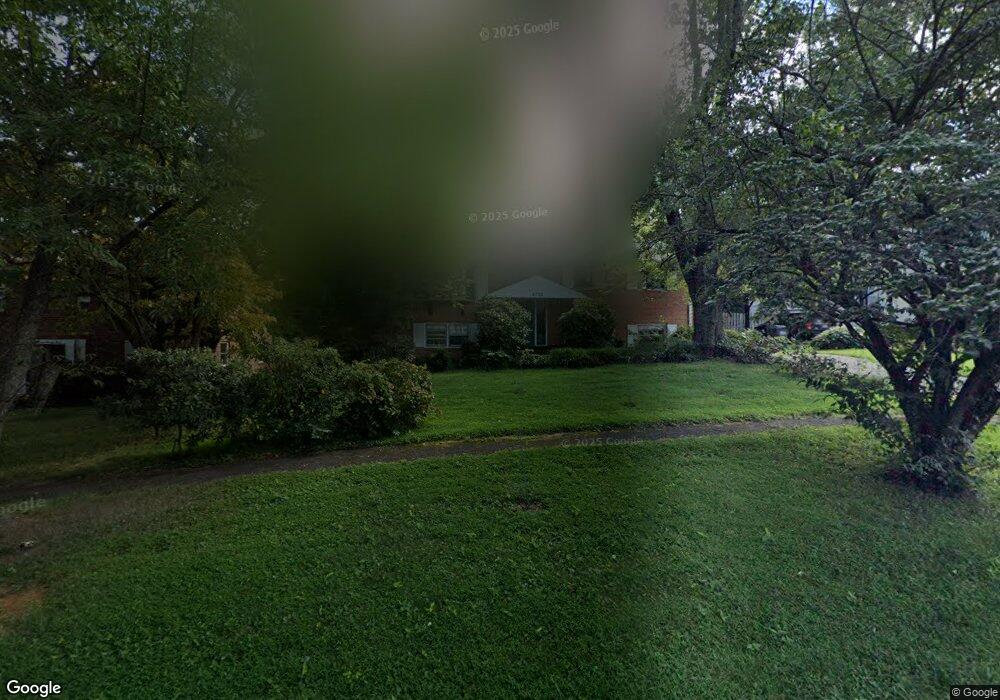
6725 Haycock Rd Falls Church, VA 22043
Estimated Value: $1,108,171 - $1,296,000
5
Beds
4
Baths
1,260
Sq Ft
$928/Sq Ft
Est. Value
About This Home
This home is located at 6725 Haycock Rd, Falls Church, VA 22043 and is currently estimated at $1,169,793, approximately $928 per square foot. 6725 Haycock Rd is a home located in Fairfax County with nearby schools including Haycock Elementary School, Longfellow Middle School, and St. James Catholic School.
Ownership History
Date
Name
Owned For
Owner Type
Purchase Details
Closed on
Aug 18, 2003
Sold by
Harsel Jospeh S
Bought by
Began Elizabeth
Current Estimated Value
Purchase Details
Closed on
Aug 25, 1998
Sold by
Hughes Philip R
Bought by
Harsel Joseph S
Home Financials for this Owner
Home Financials are based on the most recent Mortgage that was taken out on this home.
Original Mortgage
$200,000
Interest Rate
6.86%
Create a Home Valuation Report for This Property
The Home Valuation Report is an in-depth analysis detailing your home's value as well as a comparison with similar homes in the area
Home Values in the Area
Average Home Value in this Area
Purchase History
| Date | Buyer | Sale Price | Title Company |
|---|---|---|---|
| Began Elizabeth | $460,000 | -- | |
| Harsel Joseph S | $250,000 | -- |
Source: Public Records
Mortgage History
| Date | Status | Borrower | Loan Amount |
|---|---|---|---|
| Previous Owner | Harsel Joseph S | $200,000 |
Source: Public Records
Tax History Compared to Growth
Tax History
| Year | Tax Paid | Tax Assessment Tax Assessment Total Assessment is a certain percentage of the fair market value that is determined by local assessors to be the total taxable value of land and additions on the property. | Land | Improvement |
|---|---|---|---|---|
| 2025 | $10,965 | $1,034,320 | $595,000 | $439,320 |
| 2024 | $10,965 | $928,090 | $490,000 | $438,090 |
| 2023 | $9,929 | $862,310 | $435,000 | $427,310 |
| 2022 | $9,629 | $825,490 | $435,000 | $390,490 |
| 2021 | $9,374 | $783,490 | $393,000 | $390,490 |
| 2020 | $9,356 | $775,490 | $385,000 | $390,490 |
| 2019 | $8,545 | $708,250 | $350,000 | $358,250 |
| 2018 | $7,685 | $668,230 | $350,000 | $318,230 |
| 2017 | $7,802 | $658,990 | $347,000 | $311,990 |
| 2016 | $7,980 | $675,410 | $347,000 | $328,410 |
| 2015 | $7,185 | $630,820 | $321,000 | $309,820 |
| 2014 | $6,749 | $593,820 | $284,000 | $309,820 |
Source: Public Records
Map
Nearby Homes
- 6712 Moly Dr
- 2202 Grayson Place
- 6927 Haycock Rd
- 2240 Highland Terrace
- 2118 Greenwich St
- 6703 Hallwood Ave
- 6616 Fisher Ave
- 2221 Orchid Dr
- 6990 Falls Reach Dr Unit 313
- 6613 Fisher Ave
- 2300 Meridian St
- 6616 Kirby Ct
- 6940 Spruce St
- 6610 Quinten St
- 6956 Birch St
- 6609 Rockmont Ct
- 6601 Gordon Ave
- 6975 Idylwood Rd
- 1200 Offutt Dr
- 2302 Westmoreland St
- 6723 Haycock Rd
- 6727 Haycock Rd
- 6721 Haycock Rd
- 6797 Colby Crossing Way
- 2211 Great Falls St
- 6794 Colby Crossing Way
- 6719 Haycock Rd
- 6799 Colby Crossing Way
- 6726 Haycock Rd
- 6795 Colby Crossing Way
- 6728 Haycock Rd
- 6722 Haycock Rd
- 6730 Haycock Rd
- 6717 Haycock Rd
- 6710 Moly Dr
- 2217 Great Falls St
- 6708 Moly Dr
- 6718 Haycock Rd
- 2205 Great Falls St
- 6706 Moly Dr