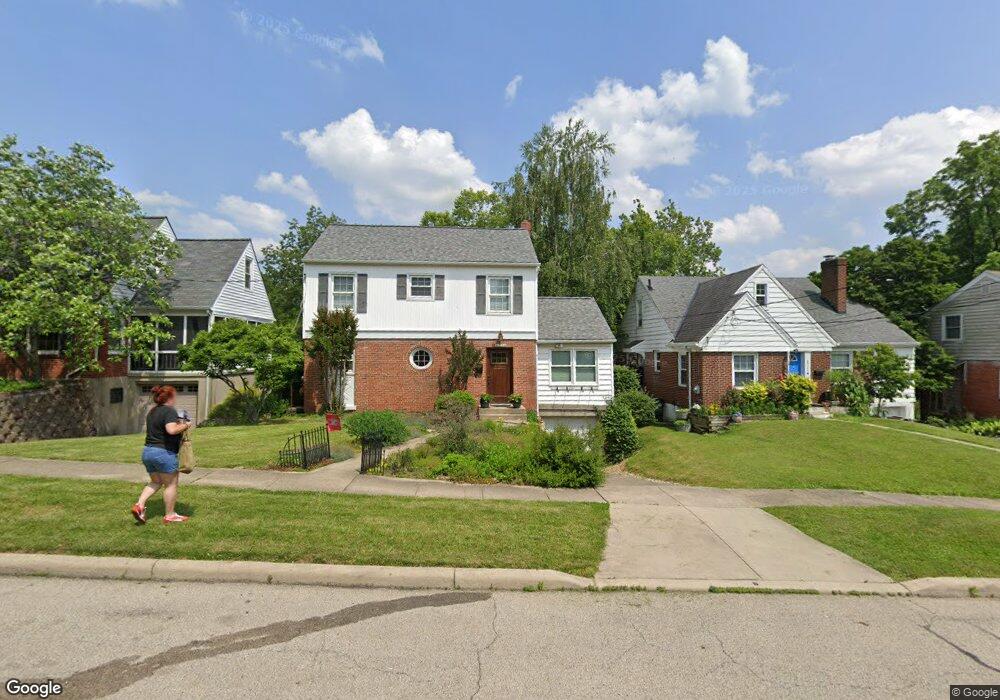
6726 Sampson Ln Cincinnati, OH 45236
Estimated Value: $216,000 - $289,000
2
Beds
1
Bath
1,432
Sq Ft
$178/Sq Ft
Est. Value
About This Home
This home is located at 6726 Sampson Ln, Cincinnati, OH 45236 and is currently estimated at $255,155, approximately $178 per square foot. 6726 Sampson Ln is a home located in Hamilton County with nearby schools including Silverton Paideia Elementary School, Shroder High School, and Clark Montessori High School.
Ownership History
Date
Name
Owned For
Owner Type
Purchase Details
Closed on
Aug 7, 2008
Sold by
Klass Properties Llc
Bought by
Heekin Leah L
Current Estimated Value
Home Financials for this Owner
Home Financials are based on the most recent Mortgage that was taken out on this home.
Original Mortgage
$100,000
Interest Rate
6.51%
Mortgage Type
Future Advance Clause Open End Mortgage
Purchase Details
Closed on
Jun 26, 2007
Sold by
Wells Fargo Bank Na
Bought by
Klass Properties Llc
Home Financials for this Owner
Home Financials are based on the most recent Mortgage that was taken out on this home.
Original Mortgage
$81,000
Interest Rate
6.42%
Mortgage Type
Unknown
Purchase Details
Closed on
May 2, 2007
Sold by
Segar Donald
Bought by
Wells Fargo Bank Minnesota Na
Home Financials for this Owner
Home Financials are based on the most recent Mortgage that was taken out on this home.
Original Mortgage
$81,000
Interest Rate
6.42%
Mortgage Type
Unknown
Create a Home Valuation Report for This Property
The Home Valuation Report is an in-depth analysis detailing your home's value as well as a comparison with similar homes in the area
Home Values in the Area
Average Home Value in this Area
Purchase History
| Date | Buyer | Sale Price | Title Company |
|---|---|---|---|
| Heekin Leah L | $100,000 | Attorney | |
| Klass Properties Llc | $74,200 | Sovereign Title Agency Llc | |
| Wells Fargo Bank Minnesota Na | $74,000 | None Available |
Source: Public Records
Mortgage History
| Date | Status | Borrower | Loan Amount |
|---|---|---|---|
| Closed | Heekin Leah L | $100,000 | |
| Previous Owner | Klass Properties Llc | $81,000 |
Source: Public Records
Tax History
| Year | Tax Paid | Tax Assessment Tax Assessment Total Assessment is a certain percentage of the fair market value that is determined by local assessors to be the total taxable value of land and additions on the property. | Land | Improvement |
|---|---|---|---|---|
| 2025 | $3,233 | $51,878 | $12,170 | $39,708 |
| 2024 | $2,960 | $51,878 | $12,170 | $39,708 |
| 2023 | $3,026 | $51,878 | $12,170 | $39,708 |
| 2022 | $2,350 | $34,083 | $9,156 | $24,927 |
| 2021 | $2,289 | $34,083 | $9,156 | $24,927 |
| 2020 | $2,325 | $34,083 | $9,156 | $24,927 |
| 2019 | $2,531 | $33,415 | $8,978 | $24,437 |
| 2018 | $2,535 | $33,415 | $8,978 | $24,437 |
| 2017 | $2,422 | $33,415 | $8,978 | $24,437 |
| 2016 | $2,336 | $31,644 | $8,082 | $23,562 |
| 2015 | $2,112 | $31,644 | $8,082 | $23,562 |
| 2014 | $2,126 | $31,644 | $8,082 | $23,562 |
| 2013 | $2,401 | $35,158 | $8,978 | $26,180 |
Source: Public Records
Map
Nearby Homes
- 6705 Elwynne Dr
- 6656 Plainfield Rd
- 6829 Alpine Ave
- 5635 Euclid Rd
- 4155 Home St
- 3964 Zinsle Ave
- 3911 E Gatewood Ln
- 4248 South Ave
- 3906 Standish Ave
- 7034 East Ave
- 4025 Deer Park Ave
- 3824 Standish Ave
- 3962 S Fordham Place
- 6508 Coleridge Ave
- 3765 Iona Ave
- 6501 Coleridge Ave
- 3946 Cedarwood Place
- 7211 Maryland Ave
- 6460 Mchugh Place
- 6097 W Fordham Place
- 6722 Sampson Ln
- 6730 Sampson Ln
- 6720 Sampson Ln
- 6734 Sampson Ln
- 6725 Elwynne Dr
- 6714 Sampson Ln
- 6729 Elwynne Dr
- 6721 Elwynne Dr
- 6738 Sampson Ln
- 6733 Elwynne Dr
- 6717 Elwynne Dr
- 6737 Elwynne Dr
- 6708 Sampson Ln
- 6742 Sampson Ln
- 6713 Elwynne Dr
- 6727 Sampson Ln
- 6723 Sampson Ln
- 6731 Sampson Ln
- 6719 Sampson Ln
- 6735 Sampson Ln
Your Personal Tour Guide
Ask me questions while you tour the home.