Estimated Value: $230,000 - $275,000
2
Beds
1
Bath
1,040
Sq Ft
$241/Sq Ft
Est. Value
About This Home
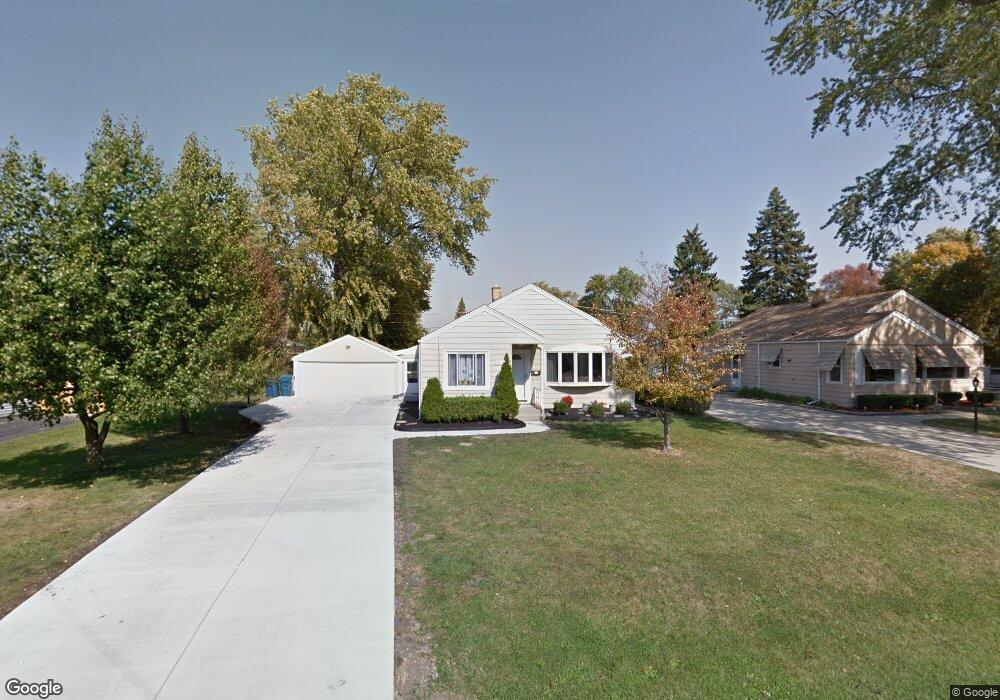
This home is located at 6726 W 112th St, Worth, IL 60482 and is currently estimated at $250,990, approximately $241 per square foot. 6726 W 112th St is a home located in Cook County with nearby schools including Worth Elementary School, Worth Jr High School, and A B Shepard High School.
Ownership History
Date
Name
Owned For
Owner Type
Purchase Details
Closed on
Nov 21, 2006
Sold by
Gliva Jerome and Gliva Cynthia
Bought by
Wrzesinski Michael E and Razo Annette M
Current Estimated Value
Home Financials for this Owner
Home Financials are based on the most recent Mortgage that was taken out on this home.
Original Mortgage
$183,750
Outstanding Balance
$109,421
Interest Rate
6.33%
Mortgage Type
Purchase Money Mortgage
Estimated Equity
$141,569
Purchase Details
Closed on
Mar 2, 2006
Sold by
Standard Bank & Trust Co
Bought by
Gliva Jerome B and Gliva Cynthia
Home Financials for this Owner
Home Financials are based on the most recent Mortgage that was taken out on this home.
Original Mortgage
$167,105
Interest Rate
8.62%
Mortgage Type
Fannie Mae Freddie Mac
Purchase Details
Closed on
Jan 9, 1996
Sold by
Heimo Arnold J
Bought by
Standard Bank & Trust Company
Create a Home Valuation Report for This Property
The Home Valuation Report is an in-depth analysis detailing your home's value as well as a comparison with similar homes in the area
Home Values in the Area
Average Home Value in this Area
Purchase History
| Date | Buyer | Sale Price | Title Company |
|---|---|---|---|
| Wrzesinski Michael E | $245,000 | Attorneys Title Guaranty Fun | |
| Gliva Jerome B | $176,000 | Cti | |
| Standard Bank & Trust Company | -- | -- |
Source: Public Records
Mortgage History
| Date | Status | Borrower | Loan Amount |
|---|---|---|---|
| Open | Wrzesinski Michael E | $183,750 | |
| Previous Owner | Gliva Jerome B | $167,105 |
Source: Public Records
Tax History Compared to Growth
Tax History
| Year | Tax Paid | Tax Assessment Tax Assessment Total Assessment is a certain percentage of the fair market value that is determined by local assessors to be the total taxable value of land and additions on the property. | Land | Improvement |
|---|---|---|---|---|
| 2024 | $4,159 | $14,932 | $4,678 | $10,254 |
| 2023 | $3,640 | $14,932 | $4,678 | $10,254 |
| 2022 | $3,640 | $12,049 | $4,093 | $7,956 |
| 2021 | $3,539 | $12,049 | $4,093 | $7,956 |
| 2020 | $3,550 | $12,049 | $4,093 | $7,956 |
| 2019 | $3,218 | $11,097 | $3,703 | $7,394 |
| 2018 | $3,459 | $11,711 | $3,703 | $8,008 |
| 2017 | $3,747 | $12,345 | $3,703 | $8,642 |
| 2016 | $3,103 | $9,431 | $3,118 | $6,313 |
| 2015 | $2,991 | $9,431 | $3,118 | $6,313 |
| 2014 | $2,955 | $9,431 | $3,118 | $6,313 |
| 2013 | $3,720 | $12,218 | $3,118 | $9,100 |
Source: Public Records
Map
Nearby Homes
- 6856 W Crandall Ave
- 6532 W 112th St
- 11334 S Natoma Ave
- 6545 W 111th St
- 11334 S Nashville Ave
- 10900 S Rutherford Ave
- 10940 S Worth Ave Unit 1094011
- 10817 S Oak Park Ave
- 6710 W 115th St
- 10910 S Natchez Ave
- 10956 S Nagle Ave
- 7040 W 114th St
- 6806 W Lode Dr Unit 1B
- 11245 S Harlem Ave Unit A12
- 10735 S Lloyd Dr
- 7034 W 114th Place
- 10738 S New England Ave
- 11524 S Ridgeland Ave
- 7201 W 110th St
- 7112 W 114th Place
- 6722 W 112th St
- 6718 W 112th St
- 11159 S Oak Park Ave
- 11159 S Oak Park Ave
- 11159 S Oak Park Ave
- 11151 S Oak Park Ave
- 11151 S Oak Park Ave
- 11145 S Oak Park Ave
- 11145 S Oak Park Ave
- 6743 W 111th Place
- 6737 W 111th Place
- 6714 W 112th St
- 11141 S Oak Park Ave
- 11141 S Oak Park Ave
- 6731 W 111th Place
- 11201 S Oak Park Ave
- 6749 W 111th Place
- 6725 W 111th Place
- 6725 W 112th St
- 11205 S Oak Park Ave