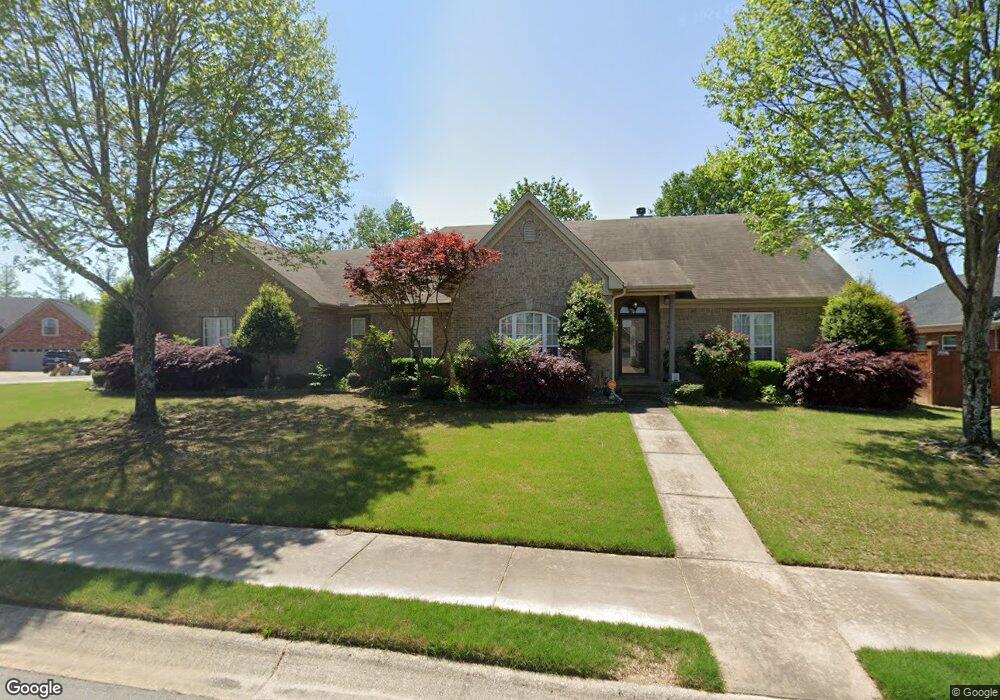
6727 Austin Harbor Loop Sherwood, AR 72120
Estimated Value: $337,176 - $379,000
--
Bed
3
Baths
2,166
Sq Ft
$165/Sq Ft
Est. Value
About This Home
This home is located at 6727 Austin Harbor Loop, Sherwood, AR 72120 and is currently estimated at $356,794, approximately $164 per square foot. 6727 Austin Harbor Loop is a home located in Pulaski County with nearby schools including Clinton Elementary School, Sylvan Hills Middle School, and Sylvan Hills High School.
Ownership History
Date
Name
Owned For
Owner Type
Purchase Details
Closed on
Jul 9, 2015
Sold by
White Freida L
Bought by
Folen Joseph W and Folen Patsy R
Current Estimated Value
Purchase Details
Closed on
Aug 12, 2005
Sold by
White Wingate F and White Freida L
Bought by
White Freida L
Home Financials for this Owner
Home Financials are based on the most recent Mortgage that was taken out on this home.
Original Mortgage
$100,000
Interest Rate
5.61%
Mortgage Type
Stand Alone Refi Refinance Of Original Loan
Purchase Details
Closed on
Feb 7, 2005
Sold by
Austin Lakes On The Bay Llc
Bought by
White Wingate F and White Freida L
Home Financials for this Owner
Home Financials are based on the most recent Mortgage that was taken out on this home.
Original Mortgage
$145,000
Interest Rate
5.8%
Mortgage Type
Construction
Create a Home Valuation Report for This Property
The Home Valuation Report is an in-depth analysis detailing your home's value as well as a comparison with similar homes in the area
Home Values in the Area
Average Home Value in this Area
Purchase History
| Date | Buyer | Sale Price | Title Company |
|---|---|---|---|
| Folen Joseph W | $236,000 | First National Title Company | |
| White Freida L | -- | American Abstract & Title Co | |
| White Wingate F | $31,000 | American Abstract & Title Co |
Source: Public Records
Mortgage History
| Date | Status | Borrower | Loan Amount |
|---|---|---|---|
| Previous Owner | White Freida L | $100,000 | |
| Previous Owner | White Wingate F | $145,000 |
Source: Public Records
Tax History Compared to Growth
Tax History
| Year | Tax Paid | Tax Assessment Tax Assessment Total Assessment is a certain percentage of the fair market value that is determined by local assessors to be the total taxable value of land and additions on the property. | Land | Improvement |
|---|---|---|---|---|
| 2025 | $2,316 | $54,359 | $4,800 | $49,559 |
| 2024 | $2,316 | $54,359 | $4,800 | $49,559 |
| 2023 | $2,316 | $54,359 | $4,800 | $49,559 |
| 2022 | $2,605 | $54,359 | $4,800 | $49,559 |
| 2021 | $2,526 | $44,460 | $6,600 | $37,860 |
| 2020 | $2,148 | $44,460 | $6,600 | $37,860 |
| 2019 | $2,148 | $44,460 | $6,600 | $37,860 |
| 2018 | $2,173 | $44,460 | $6,600 | $37,860 |
| 2017 | $2,173 | $44,460 | $6,600 | $37,860 |
| 2016 | $2,348 | $47,810 | $6,200 | $41,610 |
| 2015 | $2,372 | $47,810 | $6,200 | $41,610 |
| 2014 | $2,372 | $46,694 | $6,200 | $40,494 |
Source: Public Records
Map
Nearby Homes
- 6608 Southshore Ln
- 6 W Laramie Dr
- 404 May St
- 400 Cherrie Ave
- 106 Winona Dr
- 401 Calloway Ave
- 3600 E Kiehl Ave
- 309 May St
- 606 Bay View Ct
- 201 Bearskin Dr
- 300 Calloway Ave
- 208 Calloway Ave
- 608 Hemphill Rd
- 3116 Maxine Ave
- 114 May St
- 208 Ann Ave
- 2724 E Maryland Ave
- 110 Ann Ave
- Lot 2 Witts Dr
- Lot 1 Witts Dr
- 6757 Austin Harbor Loop
- 6749 Austin Harbor Loop
- 6841 Austin Harbor Loop
- 6733 Austin Harbor Loop
- 6756 Austin Harbor Loop
- 6764 Austin Harbor Loop
- 6748 Austin Harbor Loop
- 6772 Austin Harbor Loop
- 6840 Austin Harbor Loop
- 6832 Austin Harbor Loop
- 6725 Austin Harbor Loop
- 6824 Austin Harbor Loop
- 6849 Austin Harbor Loop
- 6800 Austin Harbor Loop
- 6740 Austin Harbor Loop
- 6848 Austin Harbor Loop
- 6818 Austin Harbor Loop
- 6732 Austin Harbor Loop
- 6717 Austin Harbor Loop
- 6857 Austin Harbor Loop