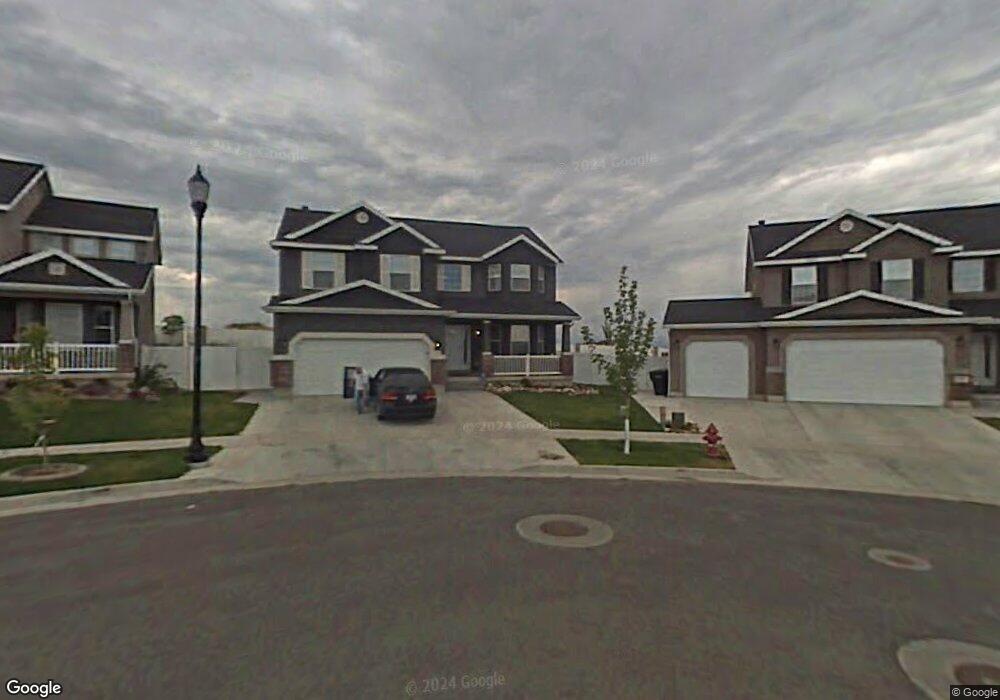
6728 Sunset Maple Dr West Jordan, UT 84081
Jordan Hills NeighborhoodEstimated Value: $635,000 - $707,000
4
Beds
3
Baths
3,168
Sq Ft
$212/Sq Ft
Est. Value
About This Home
This home is located at 6728 Sunset Maple Dr, West Jordan, UT 84081 and is currently estimated at $672,228, approximately $212 per square foot. 6728 Sunset Maple Dr is a home located in Salt Lake County with nearby schools including Fox Hollow School, Sunset Ridge Middle School, and Copper Hills High School.
Ownership History
Date
Name
Owned For
Owner Type
Purchase Details
Closed on
Mar 20, 2023
Sold by
Michael George B
Bought by
Vogel Robert and Vogel Barbara
Current Estimated Value
Home Financials for this Owner
Home Financials are based on the most recent Mortgage that was taken out on this home.
Original Mortgage
$474,000
Outstanding Balance
$459,012
Interest Rate
6.09%
Mortgage Type
New Conventional
Estimated Equity
$213,216
Purchase Details
Closed on
Aug 1, 2011
Sold by
Scholes Wayne and Scholes Heather
Bought by
Michael George B
Home Financials for this Owner
Home Financials are based on the most recent Mortgage that was taken out on this home.
Original Mortgage
$214,423
Interest Rate
4.25%
Mortgage Type
FHA
Create a Home Valuation Report for This Property
The Home Valuation Report is an in-depth analysis detailing your home's value as well as a comparison with similar homes in the area
Home Values in the Area
Average Home Value in this Area
Purchase History
| Date | Buyer | Sale Price | Title Company |
|---|---|---|---|
| Vogel Robert | -- | Meridian Title Company | |
| Michael George B | -- | Equity Title |
Source: Public Records
Mortgage History
| Date | Status | Borrower | Loan Amount |
|---|---|---|---|
| Open | Vogel Robert | $474,000 | |
| Previous Owner | Michael George B | $214,423 |
Source: Public Records
Tax History Compared to Growth
Tax History
| Year | Tax Paid | Tax Assessment Tax Assessment Total Assessment is a certain percentage of the fair market value that is determined by local assessors to be the total taxable value of land and additions on the property. | Land | Improvement |
|---|---|---|---|---|
| 2025 | $3,532 | $656,500 | $154,200 | $502,300 |
| 2024 | $3,532 | $621,900 | $148,200 | $473,700 |
| 2023 | $3,375 | $558,800 | $142,600 | $416,200 |
| 2022 | $3,564 | $586,300 | $139,800 | $446,500 |
| 2021 | $3,143 | $478,400 | $107,500 | $370,900 |
| 2020 | $2,861 | $407,400 | $99,700 | $307,700 |
| 2019 | $2,808 | $391,600 | $94,100 | $297,500 |
| 2018 | $2,628 | $362,500 | $94,100 | $268,400 |
| 2017 | $2,506 | $342,000 | $94,100 | $247,900 |
| 2016 | $2,607 | $334,500 | $87,100 | $247,400 |
| 2015 | $2,211 | $274,800 | $93,700 | $181,100 |
| 2014 | $2,101 | $256,600 | $90,800 | $165,800 |
Source: Public Records
Map
Nearby Homes
- 7474 S Sunset Maple Dr
- 6777 Grevillea Ln
- 6934 Pointe Cedar Ln Unit 330
- 7613 Oak Hallow Rd Unit 325
- 6969 W Hidden Hills Way
- 6938 Pointe Cedar Ln Unit 331
- 6973 W Hidden Hills Way Unit 146
- 6973 W Hidden Hills Way
- 6988 W Hidden Hills Way Unit 180
- 7034 W Terraine Rd
- 6793 Tupelo Ln
- 7048 W Terraine Rd Unit 160
- 7056 W Terraine Rd Unit 161
- 7577 S New Sycamore Dr
- 7062 W Terraine Rd Unit 162
- 6412 W Chan Reese Dr
- The Chisolm Plan at The Field - Reverie Collection
- Chisolm Plan at The Ramble - Terraine - Reverie Collection
- Egret Plan at The Ramble - Terraine - Reverie Collection
- Hemingford Plan at The Ramble - Terraine - Aura Collection
- 6728 W Sunset Maple Dr
- 6732 Sunset Maple Dr
- 6732 W Sunset Maple Dr
- 7419 Valley Maple Dr
- 6736 W Sunset Maple Dr Unit 519
- 6736 W Sunset Maple Dr
- 6736 Sunset Maple Dr
- 7423 S Valley Maple Dr
- 7423 Valley Maple Dr
- 6733 Sunset Maple Dr
- 6733 W Sunset Maple Dr
- 6742 W Sunset Maple Dr
- 6742 Sunset Maple Dr
- 7427 Valley Maple Dr
- 7427 S Valley Maple Dr
- 6737 Sunset Maple Dr
- 6737 W Sunset Maple Dr
- 7412 Sunset Maple Dr
- 7412 S Sunset Maple Dr
- 7443 Valley Maple Dr