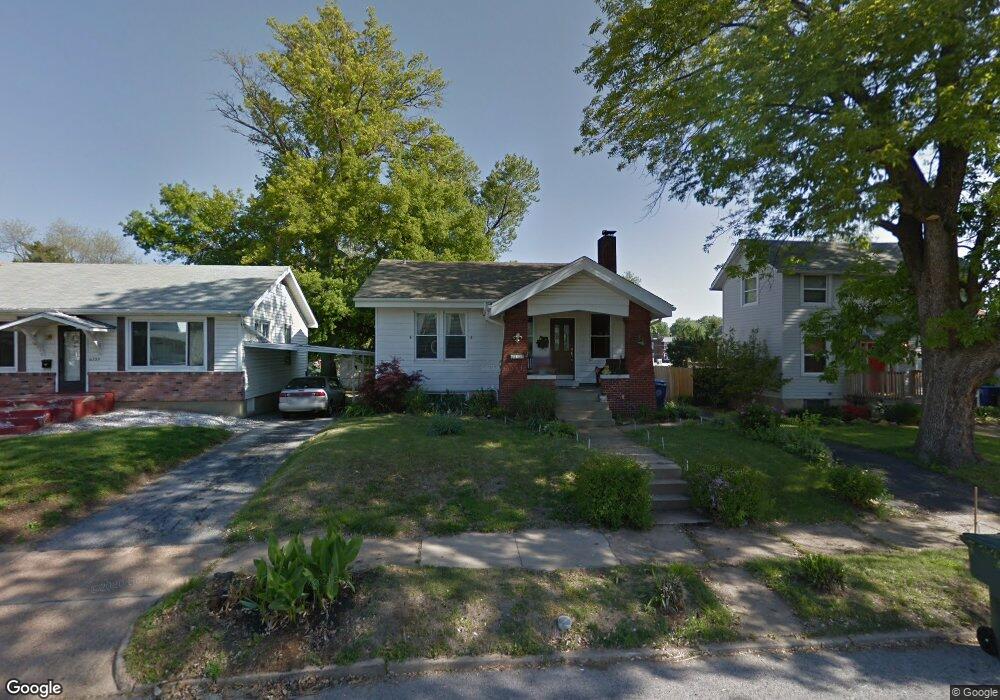
6729 Arthur Ave Saint Louis, MO 63139
Lindenwood Park NeighborhoodEstimated Value: $196,935 - $266,000
--
Bed
1
Bath
2,204
Sq Ft
$109/Sq Ft
Est. Value
About This Home
This home is located at 6729 Arthur Ave, Saint Louis, MO 63139 and is currently estimated at $241,234, approximately $109 per square foot. 6729 Arthur Ave is a home located in St. Louis City with nearby schools including Mason Elementary School, Long International Middle School, and Roosevelt High School.
Ownership History
Date
Name
Owned For
Owner Type
Purchase Details
Closed on
Feb 20, 2015
Sold by
Hogendobler Michael D and Eilering Bonnie J
Bought by
Eilering Bonnie J
Current Estimated Value
Purchase Details
Closed on
Aug 6, 2010
Sold by
Hogendobler Bonnie J and Hogendobler Michael D
Bought by
Hogendobler Bonnie J and Hogendobler Michael D
Home Financials for this Owner
Home Financials are based on the most recent Mortgage that was taken out on this home.
Original Mortgage
$80,000
Outstanding Balance
$52,888
Interest Rate
4.54%
Mortgage Type
New Conventional
Estimated Equity
$188,346
Purchase Details
Closed on
Nov 15, 2001
Sold by
Roesch Edward J and Roesch Debbie S
Bought by
Symsack Bonnie E
Home Financials for this Owner
Home Financials are based on the most recent Mortgage that was taken out on this home.
Original Mortgage
$53,200
Interest Rate
6.59%
Mortgage Type
Purchase Money Mortgage
Create a Home Valuation Report for This Property
The Home Valuation Report is an in-depth analysis detailing your home's value as well as a comparison with similar homes in the area
Home Values in the Area
Average Home Value in this Area
Purchase History
| Date | Buyer | Sale Price | Title Company |
|---|---|---|---|
| Eilering Bonnie J | -- | None Available | |
| Hogendobler Bonnie J | -- | -- | |
| Symsack Bonnie E | -- | -- |
Source: Public Records
Mortgage History
| Date | Status | Borrower | Loan Amount |
|---|---|---|---|
| Open | Hogendobler Bonnie J | $80,000 | |
| Closed | Symsack Bonnie E | $53,200 |
Source: Public Records
Tax History Compared to Growth
Tax History
| Year | Tax Paid | Tax Assessment Tax Assessment Total Assessment is a certain percentage of the fair market value that is determined by local assessors to be the total taxable value of land and additions on the property. | Land | Improvement |
|---|---|---|---|---|
| 2025 | $2,438 | $33,780 | $3,800 | $29,980 |
| 2024 | $2,319 | $28,790 | $3,800 | $24,990 |
| 2023 | $2,319 | $28,790 | $3,800 | $24,990 |
| 2022 | $2,255 | $26,940 | $3,800 | $23,140 |
| 2021 | $2,252 | $26,940 | $3,800 | $23,140 |
| 2020 | $2,046 | $24,640 | $3,800 | $20,840 |
| 2019 | $2,039 | $24,640 | $3,800 | $20,840 |
| 2018 | $1,912 | $22,380 | $3,380 | $19,000 |
| 2017 | $1,880 | $22,380 | $3,380 | $19,000 |
| 2016 | $1,536 | $17,990 | $3,380 | $14,610 |
| 2015 | $1,393 | $17,990 | $3,380 | $14,610 |
| 2014 | $1,328 | $17,990 | $3,380 | $14,610 |
| 2013 | -- | $17,140 | $3,380 | $13,760 |
Source: Public Records
Map
Nearby Homes
- 6653 Hancock Ave
- 3308 Jamieson Ave
- 3203 Ivanhoe Ave
- 6625 Hancock Ave
- 6811 Marquette Ave
- 6568 Smiley Ave
- 6523 Fyler Ave
- 6953 Arthur Ave
- 6656 Oleatha Ave
- 3282 Watson Rd
- 6631 Pernod Ave
- 6437 Hancock Ave
- 6611 Pernod Ave
- 6627 Arsenal St
- 6411 Hancock Ave
- 6659 Tholozan Ave
- 6621 Tholozan Ave
- 6339 Marquette Ave
- 6315 Bradley Ave
- 6325 Marquette Ave
- 6725 Arthur Ave
- 6733 Arthur Ave
- 6739 Arthur Ave
- 6721 Arthur Ave
- 6745 Arthur Ave
- 6715 Arthur Ave
- 6728 Fyler Ave
- 6726 Fyler Ave
- 6734 Fyler Ave
- 6740 Fyler Ave
- 6711 Arthur Ave
- 6801 Arthur Ave
- 6748 Fyler Ave
- 6728 Arthur Ave
- 6724 Arthur Ave
- 6734 Arthur Ave
- 6707 Arthur Ave
- 6718 Arthur Ave
- 6740 Arthur Ave
- 6809 Arthur Ave