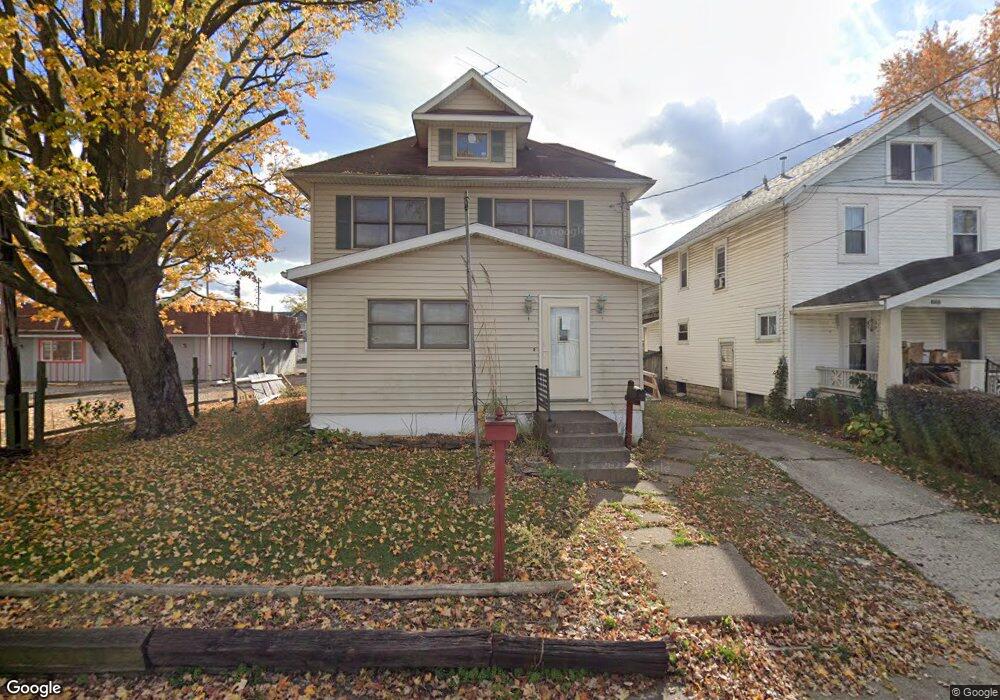
673 Bennett St Marion, OH 43302
Estimated Value: $108,000 - $148,000
4
Beds
1
Bath
1,688
Sq Ft
$77/Sq Ft
Est. Value
About This Home
This home is located at 673 Bennett St, Marion, OH 43302 and is currently estimated at $129,822, approximately $76 per square foot. 673 Bennett St is a home located in Marion County with nearby schools including James A. Garfield Elementary School, Ulysses S. Grant Middle School, and Harding High School.
Ownership History
Date
Name
Owned For
Owner Type
Purchase Details
Closed on
Jan 12, 2024
Sold by
Pinnick Billy G
Bought by
Pinnick Billy
Current Estimated Value
Home Financials for this Owner
Home Financials are based on the most recent Mortgage that was taken out on this home.
Original Mortgage
$692,393
Outstanding Balance
$678,409
Interest Rate
7.22%
Mortgage Type
FHA
Estimated Equity
-$548,587
Purchase Details
Closed on
Jan 10, 2016
Sold by
Pinnick Billy G
Bought by
Bauerle Helen J
Purchase Details
Closed on
Feb 2, 2007
Sold by
Bauerle Helen J and Pinnick Billy G
Bought by
Bauerle Helen J and Pinnick Billy G
Home Financials for this Owner
Home Financials are based on the most recent Mortgage that was taken out on this home.
Original Mortgage
$63,000
Interest Rate
6.22%
Mortgage Type
Future Advance Clause Open End Mortgage
Purchase Details
Closed on
Dec 5, 2003
Bought by
Bauerele Helen J
Create a Home Valuation Report for This Property
The Home Valuation Report is an in-depth analysis detailing your home's value as well as a comparison with similar homes in the area
Home Values in the Area
Average Home Value in this Area
Purchase History
| Date | Buyer | Sale Price | Title Company |
|---|---|---|---|
| Pinnick Billy | -- | None Listed On Document | |
| Bauerle Helen J | -- | Attorney | |
| Bauerle Helen J | -- | Title First Agency | |
| Bauerele Helen J | $70,000 | -- |
Source: Public Records
Mortgage History
| Date | Status | Borrower | Loan Amount |
|---|---|---|---|
| Open | Pinnick Billy | $692,393 | |
| Previous Owner | Bauerle Helen J | $63,000 |
Source: Public Records
Tax History
| Year | Tax Paid | Tax Assessment Tax Assessment Total Assessment is a certain percentage of the fair market value that is determined by local assessors to be the total taxable value of land and additions on the property. | Land | Improvement |
|---|---|---|---|---|
| 2025 | $1,219 | $41,360 | $2,390 | $38,970 |
| 2024 | $1,219 | $31,760 | $2,180 | $29,580 |
| 2023 | $1,219 | $31,760 | $2,180 | $29,580 |
| 2022 | $1,132 | $31,760 | $2,180 | $29,580 |
| 2021 | $1,130 | $28,570 | $1,890 | $26,680 |
| 2020 | $1,133 | $28,570 | $1,890 | $26,680 |
| 2019 | $1,132 | $28,570 | $1,890 | $26,680 |
| 2018 | $1,061 | $26,780 | $1,880 | $24,900 |
| 2017 | $1,075 | $26,780 | $1,880 | $24,900 |
| 2016 | $1,040 | $26,780 | $1,880 | $24,900 |
| 2015 | $1,040 | $26,220 | $1,790 | $24,430 |
| 2014 | $1,042 | $26,220 | $1,790 | $24,430 |
| 2012 | $1,116 | $27,900 | $2,030 | $25,870 |
Source: Public Records
Map
Nearby Homes
Your Personal Tour Guide
Ask me questions while you tour the home.