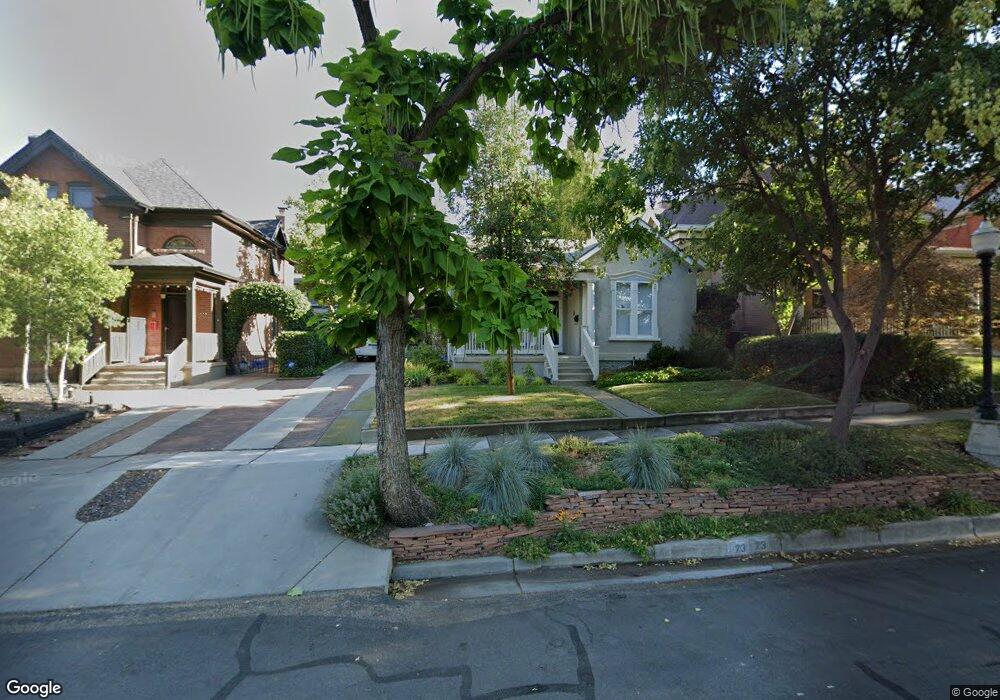
673 E 3rd Ave Salt Lake City, UT 84103
The Avenues NeighborhoodEstimated Value: $645,000 - $755,000
3
Beds
1
Bath
1,777
Sq Ft
$388/Sq Ft
Est. Value
About This Home
This home is located at 673 E 3rd Ave, Salt Lake City, UT 84103 and is currently estimated at $689,947, approximately $388 per square foot. 673 E 3rd Ave is a home located in Salt Lake County with nearby schools including Ensign School, West High, and Open Classroom.
Ownership History
Date
Name
Owned For
Owner Type
Purchase Details
Closed on
Mar 23, 2018
Sold by
Ball Janet
Bought by
Blount Janet Ball and Janet Ball Blount Revocable Trust
Current Estimated Value
Purchase Details
Closed on
Jul 21, 2014
Sold by
Allison Dennis L and Allison Niki Pappas
Bought by
Ball Janet
Home Financials for this Owner
Home Financials are based on the most recent Mortgage that was taken out on this home.
Original Mortgage
$268,000
Outstanding Balance
$203,829
Interest Rate
4.12%
Mortgage Type
New Conventional
Estimated Equity
$486,118
Purchase Details
Closed on
Jul 9, 1999
Sold by
Palmer J James and Palmer Terry H
Bought by
Allison Dennis L and Allison Niki Pappas
Purchase Details
Closed on
Apr 26, 1996
Sold by
Palmer Joseph James
Bought by
Palmer J James and Palmer Terry H
Home Financials for this Owner
Home Financials are based on the most recent Mortgage that was taken out on this home.
Original Mortgage
$93,600
Interest Rate
7.84%
Create a Home Valuation Report for This Property
The Home Valuation Report is an in-depth analysis detailing your home's value as well as a comparison with similar homes in the area
Home Values in the Area
Average Home Value in this Area
Purchase History
| Date | Buyer | Sale Price | Title Company |
|---|---|---|---|
| Blount Janet Ball | -- | None Available | |
| Ball Janet | -- | Paramount Title | |
| Allison Dennis L | -- | Associated Title | |
| Palmer J James | -- | -- |
Source: Public Records
Mortgage History
| Date | Status | Borrower | Loan Amount |
|---|---|---|---|
| Open | Ball Janet | $268,000 | |
| Previous Owner | Palmer J James | $93,600 |
Source: Public Records
Tax History Compared to Growth
Tax History
| Year | Tax Paid | Tax Assessment Tax Assessment Total Assessment is a certain percentage of the fair market value that is determined by local assessors to be the total taxable value of land and additions on the property. | Land | Improvement |
|---|---|---|---|---|
| 2025 | $570 | $641,100 | $320,600 | $320,500 |
| 2024 | $570 | $557,900 | $306,000 | $251,900 |
| 2023 | $970 | $538,500 | $294,200 | $244,300 |
| 2022 | $970 | $558,900 | $288,500 | $270,400 |
| 2021 | $142 | $444,500 | $234,400 | $210,100 |
| 2020 | $426 | $420,200 | $219,100 | $201,100 |
| 2019 | $171 | $374,200 | $209,000 | $165,200 |
| 2018 | $0 | $341,600 | $209,000 | $132,600 |
| 2017 | $38 | $327,700 | $209,000 | $118,700 |
| 2016 | $38 | $324,200 | $192,300 | $131,900 |
| 2015 | $2,639 | $303,200 | $125,000 | $178,200 |
| 2014 | $2,230 | $254,100 | $125,000 | $129,100 |
Source: Public Records
Map
Nearby Homes
- 662 E 4th Ave
- 681 E 4th Ave
- 679 E 2nd Ave
- 221 L St E
- 630 E 5th Ave
- 763 E 3rd Ave
- 216 L St
- 636 E 2nd Ave
- 777 E 2nd Ave Unit 3
- 673 E 6th Ave
- 665 E 6th Ave
- 777 E South Temple Unit 10d
- 777 E South Temple Unit 3F
- 777 E South Temple Unit 13B
- 777 E South Temple Unit 4B
- 777 E South Temple Unit 4A
- 777 E South Temple Unit 13A
- 777 E South Temple Unit 9J
- 777 E South Temple Unit 11F
- 777 E South Temple Unit 7H