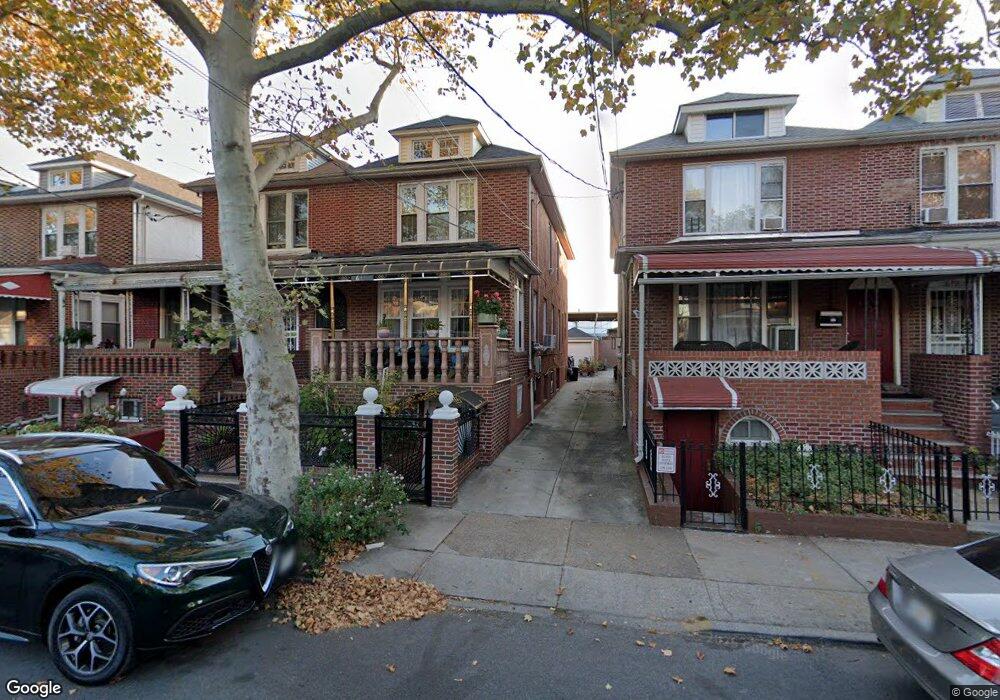
673 E 49th St Brooklyn, NY 11203
East Flatbush NeighborhoodEstimated Value: $701,053 - $965,000
Studio
--
Bath
2,848
Sq Ft
$292/Sq Ft
Est. Value
About This Home
This home is located at 673 E 49th St, Brooklyn, NY 11203 and is currently estimated at $831,013, approximately $291 per square foot. 673 E 49th St is a home located in Kings County with nearby schools including P.S. 208 Elsa Ebeling, I.S. 285 Meyer Levin, and Ivy Hill Preparatory Charter School.
Ownership History
Date
Name
Owned For
Owner Type
Purchase Details
Closed on
Nov 10, 2022
Sold by
Paul Janetta
Bought by
Janetta Paul Family Trust and Natalie Gill Trustee
Current Estimated Value
Purchase Details
Closed on
Dec 17, 1999
Sold by
Shanks Julius
Bought by
Paul Janetta
Home Financials for this Owner
Home Financials are based on the most recent Mortgage that was taken out on this home.
Original Mortgage
$176,000
Interest Rate
8.21%
Purchase Details
Closed on
Oct 10, 1998
Sold by
Shanks Julius
Bought by
Shanks Julius and Shanks David
Purchase Details
Closed on
May 27, 1994
Sold by
Shanks Peter
Bought by
Shanks Aveline
Home Financials for this Owner
Home Financials are based on the most recent Mortgage that was taken out on this home.
Original Mortgage
$70,000
Interest Rate
8.29%
Create a Home Valuation Report for This Property
The Home Valuation Report is an in-depth analysis detailing your home's value as well as a comparison with similar homes in the area
Home Values in the Area
Average Home Value in this Area
Purchase History
| Date | Buyer | Sale Price | Title Company |
|---|---|---|---|
| Janetta Paul Family Trust | -- | -- | |
| Janetta Paul Family Trust | -- | -- | |
| Janetta Paul Family Trust | -- | -- | |
| Paul Janetta | $220,000 | Fidelity National Title Ins | |
| Paul Janetta | $220,000 | Fidelity National Title Ins | |
| Shanks Julius | -- | -- | |
| Shanks Julius | -- | -- | |
| Shanks Aveline | -- | Commonwealth Land Title Ins | |
| Shanks Aveline | -- | Commonwealth Land Title Ins |
Source: Public Records
Mortgage History
| Date | Status | Borrower | Loan Amount |
|---|---|---|---|
| Previous Owner | Paul Janetta | $176,000 | |
| Previous Owner | Shanks Aveline | $70,000 |
Source: Public Records
Tax History
| Year | Tax Paid | Tax Assessment Tax Assessment Total Assessment is a certain percentage of the fair market value that is determined by local assessors to be the total taxable value of land and additions on the property. | Land | Improvement |
|---|---|---|---|---|
| 2025 | $7,086 | $41,880 | $17,100 | $24,780 |
| 2024 | $7,086 | $49,260 | $17,100 | $32,160 |
| 2023 | $1,981 | $60,120 | $17,100 | $43,020 |
| 2022 | $2,971 | $49,200 | $17,100 | $32,100 |
| 2021 | $3,139 | $47,880 | $17,100 | $30,780 |
| 2019 | $6,101 | $31,860 | $17,100 | $14,760 |
| 2018 | $5,581 | $28,836 | $13,255 | $15,581 |
| 2017 | $5,246 | $27,204 | $10,889 | $16,315 |
| 2016 | $5,128 | $27,204 | $13,578 | $13,626 |
| 2015 | $2,876 | $26,998 | $17,466 | $9,532 |
| 2014 | $2,876 | $25,471 | $14,627 | $10,844 |
Source: Public Records
Map
Nearby Homes
- 701 E 48th St
- 4824 Beverley Rd
- 5024 Clarendon Rd
- 702 E 51st St
- 4617 Clarendon Rd
- 758 E 48th St
- 1214 Schenectady Ave
- 540 E 52nd St
- 567 E 51st St
- 711 E 52nd St
- 4623 Avenue D
- 5022 Avenue D
- 5306 Beverley Rd
- 557 E 51st St
- 820 E 49th St
- 5401 Clarendon Rd
- 541 E 54th St
- 4404 Clarendon Rd
- 543 E 49th St
- 505 E 54th St
Your Personal Tour Guide
Ask me questions while you tour the home.