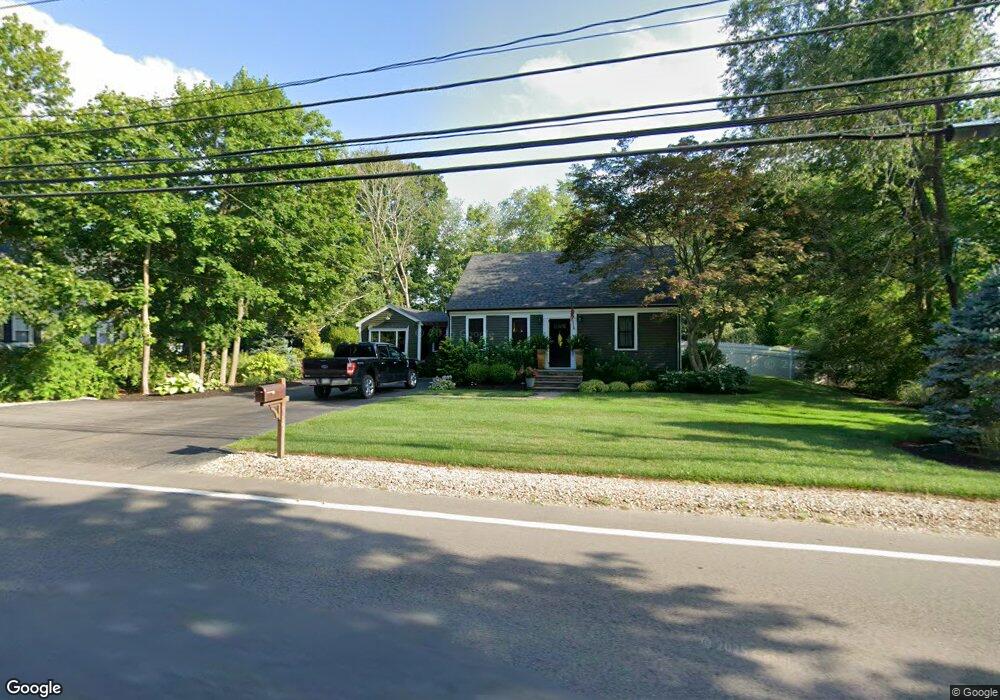
673 Main St Hanson, MA 02341
Estimated Value: $608,000 - $740,000
4
Beds
1
Bath
1,828
Sq Ft
$361/Sq Ft
Est. Value
About This Home
This home is located at 673 Main St, Hanson, MA 02341 and is currently estimated at $659,232, approximately $360 per square foot. 673 Main St is a home located in Plymouth County.
Ownership History
Date
Name
Owned For
Owner Type
Purchase Details
Closed on
Aug 8, 2018
Sold by
Pierre Matthew
Bought by
Pierre Marie C
Current Estimated Value
Purchase Details
Closed on
Sep 17, 2008
Sold by
Head Patrick G and Head Jennifer
Bought by
Head Patrick G
Purchase Details
Closed on
Jul 23, 2003
Sold by
Head Robert M
Bought by
Head Patrick G and Head Jennifer
Purchase Details
Closed on
Jul 3, 2000
Sold by
Pellegrine Robert E and Pellegrine Janice Y
Bought by
Head Robert M
Purchase Details
Closed on
Aug 23, 1988
Sold by
Sayce Randolph E
Bought by
Pellegrine Robert
Create a Home Valuation Report for This Property
The Home Valuation Report is an in-depth analysis detailing your home's value as well as a comparison with similar homes in the area
Home Values in the Area
Average Home Value in this Area
Purchase History
| Date | Buyer | Sale Price | Title Company |
|---|---|---|---|
| Pierre Marie C | -- | -- | |
| Head Patrick G | -- | -- | |
| Head Patrick G | $280,000 | -- | |
| Head Robert M | $198,500 | -- | |
| Pellegrine Robert | $139,000 | -- |
Source: Public Records
Mortgage History
| Date | Status | Borrower | Loan Amount |
|---|---|---|---|
| Previous Owner | Pellegrine Robert | $240,600 | |
| Previous Owner | Pellegrine Robert | $243,750 |
Source: Public Records
Tax History
| Year | Tax Paid | Tax Assessment Tax Assessment Total Assessment is a certain percentage of the fair market value that is determined by local assessors to be the total taxable value of land and additions on the property. | Land | Improvement |
|---|---|---|---|---|
| 2025 | $7,624 | $569,800 | $161,300 | $408,500 |
| 2024 | $7,194 | $537,700 | $156,600 | $381,100 |
| 2023 | $6,934 | $489,000 | $156,600 | $332,400 |
| 2022 | $6,421 | $425,500 | $142,400 | $283,100 |
| 2021 | $5,354 | $354,600 | $136,900 | $217,700 |
| 2020 | $5,235 | $342,800 | $132,200 | $210,600 |
| 2019 | $4,996 | $321,700 | $129,700 | $192,000 |
| 2018 | $4,899 | $309,500 | $124,700 | $184,800 |
| 2017 | $4,164 | $260,600 | $118,800 | $141,800 |
| 2016 | $4,247 | $256,600 | $118,800 | $137,800 |
| 2015 | $4,002 | $251,400 | $118,800 | $132,600 |
Source: Public Records
Map
Nearby Homes
- 1054 Main St
- 72 Phillips St
- 318 South St
- 143 Plymouth St
- 170 Elm St
- Lot 6 Way
- Lot 2 Harvard Rd
- 102 Leon Ct
- 115 Waltham St
- 361A County Rd
- 361 County Rd
- 0 Union Park St
- 134 Crescent St
- 61 Sawmill Ln
- 61 Sawmill Ln Unit 61
- 161 Winter St Unit 11
- 6 Amanda's Way Unit 6
- 131 Elmer St
- 269 Lakeside Rd
- 0 Thompson St
Your Personal Tour Guide
Ask me questions while you tour the home.