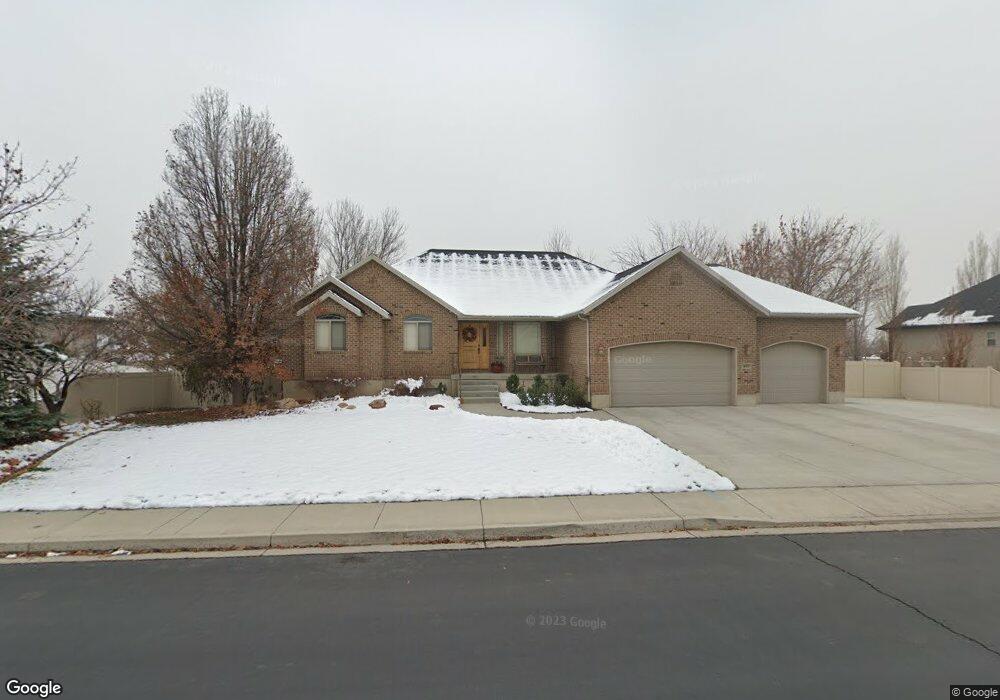
673 W 2100 N Pleasant Grove, UT 84062
Estimated Value: $763,000 - $923,462
3
Beds
3
Baths
3,950
Sq Ft
$219/Sq Ft
Est. Value
About This Home
This home is located at 673 W 2100 N, Pleasant Grove, UT 84062 and is currently estimated at $865,866, approximately $219 per square foot. 673 W 2100 N is a home located in Utah County with nearby schools including Manila Elementary School, Pleasant Grove Junior High School, and Pleasant Grove High School.
Ownership History
Date
Name
Owned For
Owner Type
Purchase Details
Closed on
Oct 25, 2005
Sold by
Carson Jim and Carson Jamie
Bought by
Anderson James N and Anderson Kathleen A H
Current Estimated Value
Purchase Details
Closed on
Jun 16, 2004
Sold by
Carson Jim and Carson Jamie
Bought by
Anderson James N
Home Financials for this Owner
Home Financials are based on the most recent Mortgage that was taken out on this home.
Original Mortgage
$120,000
Interest Rate
6.09%
Mortgage Type
Purchase Money Mortgage
Purchase Details
Closed on
Dec 11, 2003
Sold by
Allred Brothers Development Lc
Bought by
Carson Jim and Carson Jamie
Home Financials for this Owner
Home Financials are based on the most recent Mortgage that was taken out on this home.
Original Mortgage
$224,013
Interest Rate
5.92%
Mortgage Type
Construction
Create a Home Valuation Report for This Property
The Home Valuation Report is an in-depth analysis detailing your home's value as well as a comparison with similar homes in the area
Home Values in the Area
Average Home Value in this Area
Purchase History
| Date | Buyer | Sale Price | Title Company |
|---|---|---|---|
| Anderson James N | -- | Utah First Title Insurance | |
| Anderson James N | -- | Utah First Title Insurance | |
| Anderson James N | -- | Utah First Title Insurance | |
| Carson Jim | -- | Affiliated First Title Comp | |
| Carson Jim | -- | Affiliated First Title Comp |
Source: Public Records
Mortgage History
| Date | Status | Borrower | Loan Amount |
|---|---|---|---|
| Previous Owner | Anderson James N | $120,000 | |
| Previous Owner | Carson Jim | $224,013 |
Source: Public Records
Tax History Compared to Growth
Tax History
| Year | Tax Paid | Tax Assessment Tax Assessment Total Assessment is a certain percentage of the fair market value that is determined by local assessors to be the total taxable value of land and additions on the property. | Land | Improvement |
|---|---|---|---|---|
| 2025 | $3,717 | $458,645 | $432,600 | $401,300 |
| 2024 | $3,717 | $443,520 | $0 | $0 |
| 2023 | $3,604 | $440,330 | $0 | $0 |
| 2022 | $3,496 | $425,040 | $0 | $0 |
| 2021 | $2,904 | $537,600 | $246,100 | $291,500 |
| 2020 | $2,743 | $497,800 | $227,900 | $269,900 |
| 2019 | $2,378 | $446,300 | $211,600 | $234,700 |
| 2018 | $2,423 | $430,000 | $195,300 | $234,700 |
| 2017 | $2,254 | $212,960 | $0 | $0 |
| 2016 | $2,300 | $209,770 | $0 | $0 |
| 2015 | $2,429 | $209,770 | $0 | $0 |
| 2014 | $2,121 | $181,445 | $0 | $0 |
Source: Public Records
Map
Nearby Homes
- 532 W 2000 N
- 1897 N 900 W
- 980 W 1800 N
- 674 W 1590 N Unit 11
- 731 W 1590 N Unit 15
- Konlee Plan at Makin Dreams
- Alexa Plan at Makin Dreams
- Callahan Plan at Makin Dreams
- Hailey Plan at Makin Dreams
- Alydia Plan at Makin Dreams
- Addison Plan at Makin Dreams
- Julia Plan at Makin Dreams
- 1531 N 750 W Unit 4
- Aaron Plan at Makin Dreams
- Amie Plan at Makin Dreams
- Nora Plan at Makin Dreams
- Emmet Plan at Makin Dreams
- Quinn Plan at Makin Dreams
- Chelsea Plan at Makin Dreams
- Jenni Plan at Makin Dreams