673 W Chase St Hernando, FL 34442
Estimated Value: $468,912 - $601,000
About This Home
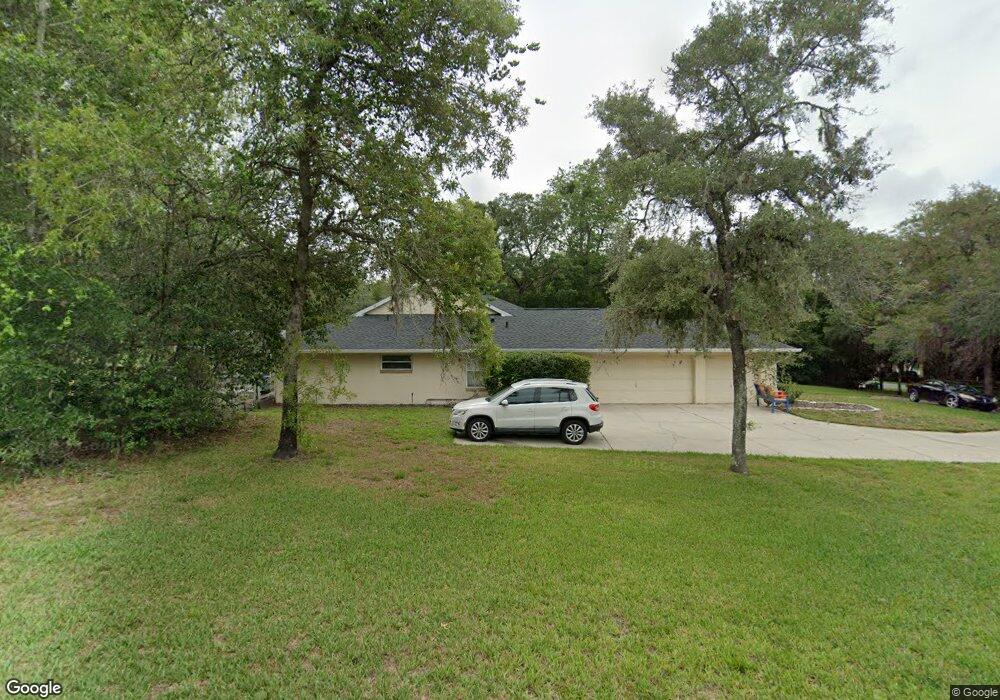
This home is located at 673 W Chase St, Hernando, FL 34442 and is currently estimated at $522,728, approximately $238 per square foot. 673 W Chase St is a home located in Citrus County with nearby schools including Forest Ridge Elementary School, Lecanto Middle School, and Lecanto High School.
Ownership History
We collect this data history from publicly available records. To have your information removed, we recommend requesting removal directly through your county’s website.
Purchase Details
Home Financials for this Owner
Home Financials are based on the most recent Mortgage that was taken out on this home.Purchase Details
Purchase Details
Home Values in the Area
Average Home Value in this Area
Purchase History
We collect this data history from publicly available records. To have your information removed, we recommend requesting removal directly through your county’s website.
| Date | Buyer | Sale Price | Title Company |
|---|---|---|---|
| $249,000 | Manatee Title Co Inc | ||
| $23,000 | -- | ||
| $22,500 | -- |
Mortgage History
We collect this data history from publicly available records. To have your information removed, we recommend requesting removal directly through your county’s website.
| Date | Status | Borrower | Loan Amount |
|---|---|---|---|
| Closed | $175,000 |
Tax History
We collect this data history from publicly available records. To have your information removed, we recommend requesting removal directly through your county’s website.
| Year | Tax Paid | Tax Assessment Tax Assessment Total Assessment is a certain percentage of the fair market value that is determined by local assessors to be the total taxable value of land and additions on the property. | Land | Improvement |
|---|---|---|---|---|
| 2025 | $2,567 | $202,422 | -- | -- |
| 2024 | $2,504 | $196,717 | -- | -- |
| 2023 | $2,504 | $190,987 | $0 | $0 |
| 2022 | $2,356 | $185,424 | $0 | $0 |
| 2021 | $2,265 | $180,023 | $0 | $0 |
| 2020 | $2,165 | $233,711 | $30,000 | $203,711 |
| 2019 | $2,137 | $219,092 | $30,000 | $189,092 |
| 2018 | $2,111 | $192,081 | $30,000 | $162,081 |
| 2017 | $2,104 | $166,806 | $30,000 | $136,806 |
| 2016 | $2,192 | $167,302 | $32,980 | $134,322 |
| 2015 | $2,285 | $169,890 | $32,980 | $136,910 |
| 2014 | $2,388 | $171,727 | $36,703 | $135,024 |
Map
- 657 W Keller St
- 421 W Chase St
- 443 W Mickey Mantle Path
- 315 W Britain St
- 1640 N Jimmie Foxx Path
- 509 W Fenway Dr
- 399 W Massachusetts St
- 724 W Massachusetts St
- 604 W Massachusetts St
- 983 W Skyview Landings Dr
- 1165 W Beagle Run Loop
- 1040 W Beagle Run Loop
- 1283 N Rockwood Point
- 807 W National St
- 161 W Chase St
- 404 W Fenway Dr
- 979 W Sun Valley Ct
- 1239 W Beagle Run Loop
- 1038 W Rollingwood Ct
- 949 W National St
- 645 W Chase St
- 1350 N Circus Terrace
- 617 W Chase St
- 668 W Britain St
- 658 W Chase St
- 680 W Chase St
- 1400 N Circus Terrace
- 1300 N Circus Terrace
- 624 W Chase St
- 610 W Britain St
- 589 W Chase St
- 596 W Chase St
- 582 W Britain St
- 1424 N Circus Terrace
- 561 W Chase St
- 570 W Chase St
- 556 W Britain St
- 657 W Britain St
- 719 W Keller St
- 629 W Keller St
Ask me questions while you tour the home.