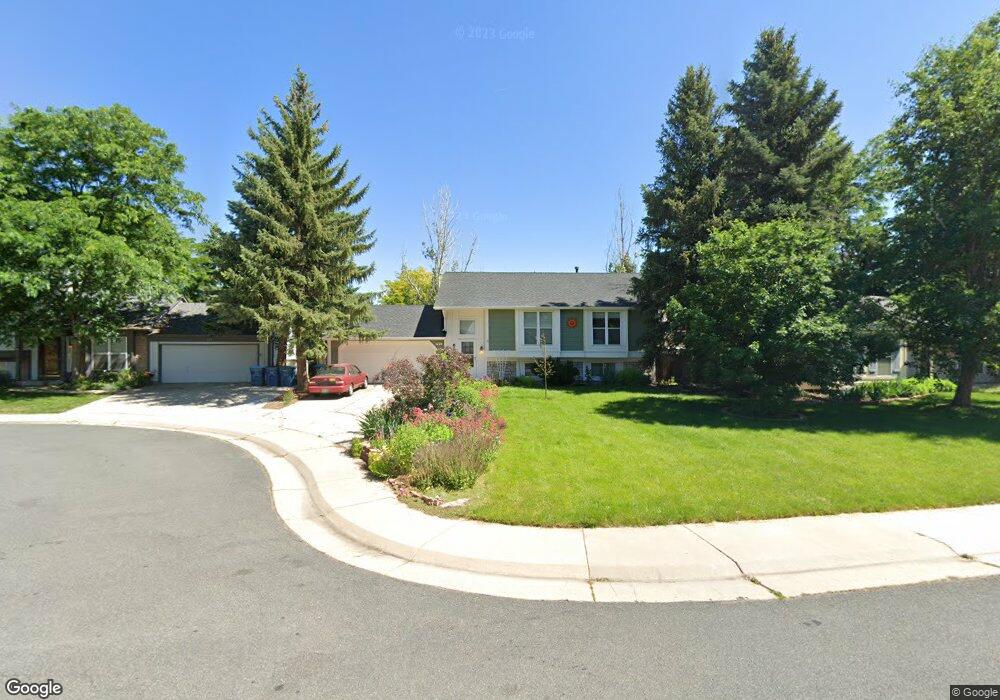
673 W Chestnut Ct Louisville, CO 80027
Estimated Value: $682,207 - $792,000
4
Beds
2
Baths
1,858
Sq Ft
$407/Sq Ft
Est. Value
About This Home
This home is located at 673 W Chestnut Ct, Louisville, CO 80027 and is currently estimated at $756,302, approximately $407 per square foot. 673 W Chestnut Ct is a home located in Boulder County with nearby schools including Fireside Elementary School, Monarch K-8 School, and Monarch High School.
Ownership History
Date
Name
Owned For
Owner Type
Purchase Details
Closed on
Nov 20, 2020
Sold by
Kenny Martha G and Estate Of Mark T Kenny
Bought by
Kenny Martha G
Current Estimated Value
Purchase Details
Closed on
Aug 1, 2008
Sold by
Kenny Mark T
Bought by
Kenny Mark T
Purchase Details
Closed on
Jul 10, 1998
Sold by
Hardesty Kathleen Lynn
Bought by
Keefe Michael
Home Financials for this Owner
Home Financials are based on the most recent Mortgage that was taken out on this home.
Original Mortgage
$146,200
Outstanding Balance
$30,153
Interest Rate
7.09%
Estimated Equity
$726,149
Purchase Details
Closed on
Mar 14, 1994
Sold by
Hardesty Jon Lamont
Bought by
Hardesty Kathleen Lynn
Purchase Details
Closed on
Nov 3, 1987
Bought by
Kenny Mark T
Purchase Details
Closed on
Dec 15, 1983
Bought by
Kenny Mark T
Create a Home Valuation Report for This Property
The Home Valuation Report is an in-depth analysis detailing your home's value as well as a comparison with similar homes in the area
Home Values in the Area
Average Home Value in this Area
Purchase History
| Date | Buyer | Sale Price | Title Company |
|---|---|---|---|
| Kenny Martha G | -- | None Available | |
| Kenny Mark T | -- | None Available | |
| Keefe Michael | $182,750 | First American Heritage Titl | |
| Hardesty Kathleen Lynn | -- | -- | |
| Kenny Mark T | $99,000 | -- | |
| Kenny Mark T | $99,900 | -- |
Source: Public Records
Mortgage History
| Date | Status | Borrower | Loan Amount |
|---|---|---|---|
| Open | Keefe Michael | $146,200 |
Source: Public Records
Tax History Compared to Growth
Tax History
| Year | Tax Paid | Tax Assessment Tax Assessment Total Assessment is a certain percentage of the fair market value that is determined by local assessors to be the total taxable value of land and additions on the property. | Land | Improvement |
|---|---|---|---|---|
| 2025 | $4,150 | $47,169 | $20,888 | $26,281 |
| 2024 | $4,150 | $47,169 | $20,888 | $26,281 |
| 2023 | $4,079 | $46,170 | $22,117 | $27,738 |
| 2022 | $3,428 | $35,625 | $16,082 | $19,543 |
| 2021 | $3,689 | $39,832 | $17,982 | $21,850 |
| 2020 | $3,364 | $35,951 | $14,515 | $21,436 |
| 2019 | $3,317 | $35,951 | $14,515 | $21,436 |
| 2018 | $2,685 | $30,053 | $9,720 | $20,333 |
| 2017 | $2,631 | $33,225 | $10,746 | $22,479 |
| 2016 | $2,616 | $29,738 | $11,701 | $18,037 |
| 2015 | $2,480 | $26,045 | $14,328 | $11,717 |
| 2014 | $2,227 | $26,045 | $14,328 | $11,717 |
Source: Public Records
Map
Nearby Homes
- 362 S Taft Ct Unit 108
- 284 S Taft Ct Unit 76
- 323 S Taft Ct Unit 26
- 305 S Taft Ct Unit 33
- 279 S Taft Ct Unit 53
- 749 Apple Ct
- 641 W Dahlia St
- 567 Manorwood Ln
- 539 Coal Creek Ln
- 546 Ridgeview Dr
- 159 S Polk Ave
- 118 S Tanager Ct
- 572 Ridgeview Dr
- 322 Diamond Cir
- 620 Ridgeview Dr
- 812 W Mulberry St
- 203 Springs Dr
- 716 Club Cir
- 408 Fillmore Ct
- 730 Copper Ln Unit 106
- 661 W Chestnut Ct
- 685 W Chestnut Ct
- 674 W Lilac Ct
- 662 W Lilac Ct
- 657 W Chestnut Ct
- 670 W Chestnut Ct
- 652 W Lilac Ct
- 686 W Lilac Ct
- 680 W Chestnut Ct
- 660 W Chestnut Ct
- 650 W Chestnut Ct
- 374 S Taft Ct Unit 114
- 372 S Taft Ct Unit 113
- 370 S Taft Ct Unit 112
- 368 S Taft Ct Unit 111
- 366 S Taft Ct Unit 110
- 364 S Taft Ct Unit 109
- 364 S Taft Ct Unit 19109
- 362 S Taft Ct Unit 18-108
- 675 W Lilac Ct