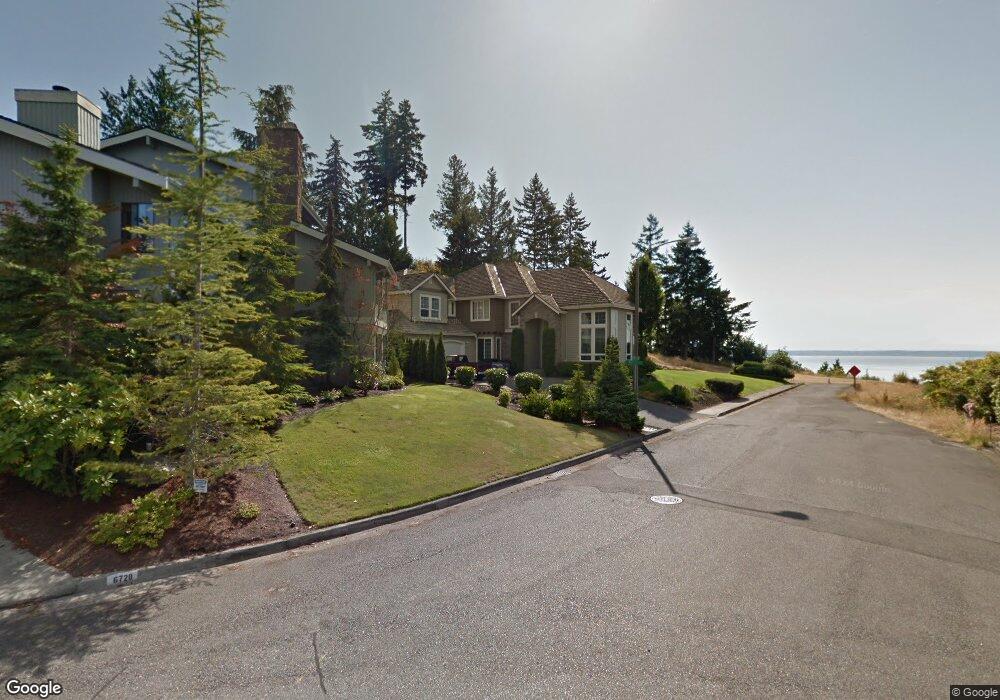
6730 139th Place SW Edmonds, WA 98026
Estimated Value: $1,965,765 - $2,205,000
3
Beds
4
Baths
3,700
Sq Ft
$576/Sq Ft
Est. Value
About This Home
This home is located at 6730 139th Place SW, Edmonds, WA 98026 and is currently estimated at $2,129,441, approximately $575 per square foot. 6730 139th Place SW is a home located in Snohomish County with nearby schools including Picnic Point Elementary School, Harbour Pointe Middle School, and Kamiak High School.
Ownership History
Date
Name
Owned For
Owner Type
Purchase Details
Closed on
Jul 29, 2002
Sold by
Hills Larry O and Hillis Veralene
Bought by
Packard Dale A and Packard Pamela L
Current Estimated Value
Home Financials for this Owner
Home Financials are based on the most recent Mortgage that was taken out on this home.
Original Mortgage
$362,540
Interest Rate
4.51%
Purchase Details
Closed on
Mar 29, 2000
Sold by
Alconmar Company Inc
Bought by
U S Builders West Llc
Home Financials for this Owner
Home Financials are based on the most recent Mortgage that was taken out on this home.
Original Mortgage
$558,750
Interest Rate
8.38%
Mortgage Type
Construction
Purchase Details
Closed on
Mar 28, 1996
Sold by
The Estates At Picnic Point Ltd Prtnrshp
Bought by
Lodwig Robert A
Create a Home Valuation Report for This Property
The Home Valuation Report is an in-depth analysis detailing your home's value as well as a comparison with similar homes in the area
Home Values in the Area
Average Home Value in this Area
Purchase History
| Date | Buyer | Sale Price | Title Company |
|---|---|---|---|
| Packard Dale A | $714,675 | Stewart | |
| Hillis Larry O | -- | -- | |
| Packard Dale A | $714,675 | -- | |
| U S Builders West Llc | $200,000 | Evergreen Title Company Inc | |
| Lodwig Robert A | $103,500 | Transnation Title Insurance |
Source: Public Records
Mortgage History
| Date | Status | Borrower | Loan Amount |
|---|---|---|---|
| Previous Owner | Packard Dale A | $362,540 | |
| Previous Owner | U S Builders West Llc | $558,750 |
Source: Public Records
Tax History Compared to Growth
Tax History
| Year | Tax Paid | Tax Assessment Tax Assessment Total Assessment is a certain percentage of the fair market value that is determined by local assessors to be the total taxable value of land and additions on the property. | Land | Improvement |
|---|---|---|---|---|
| 2025 | $14,547 | $1,800,200 | $947,600 | $852,600 |
| 2024 | $14,547 | $1,756,300 | $944,300 | $812,000 |
| 2023 | $15,692 | $1,981,800 | $1,052,900 | $928,900 |
| 2022 | $13,431 | $1,434,400 | $646,000 | $788,400 |
| 2020 | $11,944 | $1,234,800 | $590,400 | $644,400 |
| 2019 | $11,109 | $1,153,500 | $547,800 | $605,700 |
| 2018 | $10,922 | $988,500 | $448,000 | $540,500 |
| 2017 | $10,105 | $937,400 | $427,000 | $510,400 |
| 2016 | $9,093 | $837,900 | $349,000 | $488,900 |
| 2015 | $9,498 | $802,000 | $366,000 | $436,000 |
| 2013 | $8,044 | $636,800 | $295,000 | $341,800 |
Source: Public Records
Map
Nearby Homes
- 13813 68th Ave W
- 6420 141st St SW
- 6625 136th Place SW
- 6306 141st St SW
- 13802 60th Ave W
- 6122 144th St SW
- 6520 146th St SW
- 6519 148th Place SW
- 6523 128th Place SW
- 6509 128th Place SW
- 14019 52nd Ave W Unit B
- 14714 53rd Ave W Unit 116
- 14714 53rd Ave W Unit 119
- 15424 61st Place W
- 11902 Possession Ln
- 5119 136th St SW
- 5015 144th St SW Unit B1
- 5015 144th St SW Unit A4
- 5015 144th St SW Unit B3
- 5015 144th St SW Unit C1
- 6720 139th Place SW
- 6712 139th Place SW
- 13832 68th Ave W
- 6707 139th Place SW
- 13826 68th Ave W
- 6708 139th Place SW
- 13825 68th Ave W
- 6701 139th Place SW
- 14016 67th Ave W
- 6702 139th Place SW
- 13812 68th Ave W
- 14126 67th Ave W
- 13806 68th Ave W
- 6628 138th Place SW
- 6622 138th Place SW
- 6531 141st St SW
- 14122 67th Ave W
- 13730 68th Ave W
- 6705 138th Place SW
- 6603 141st St SW