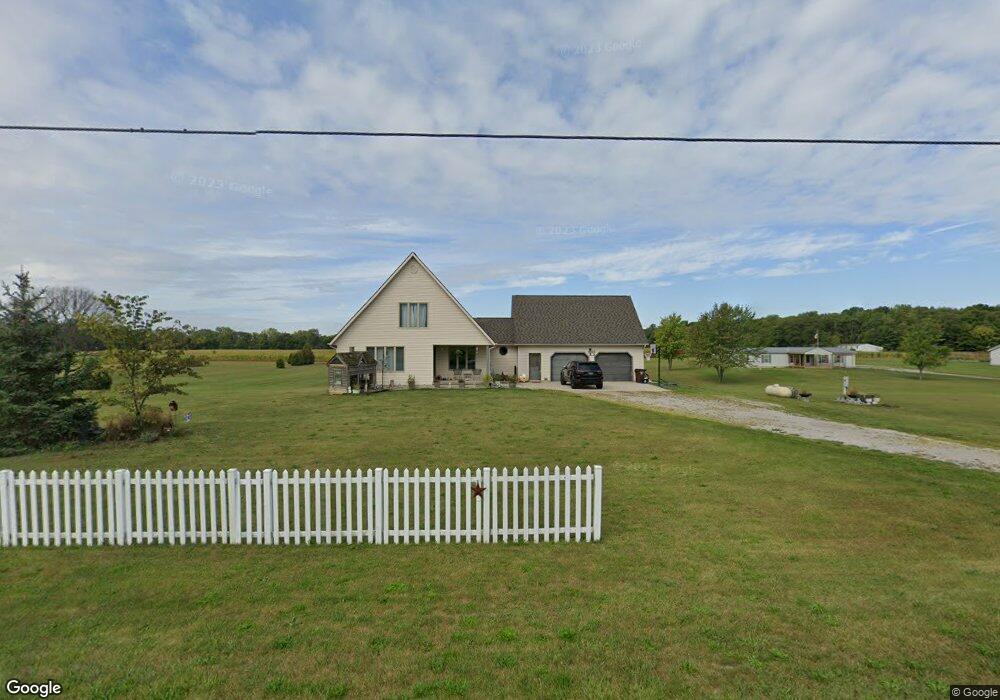
6730 Cicero Rd Hicksville, OH 43526
Estimated Value: $295,596 - $315,000
3
Beds
3
Baths
1,584
Sq Ft
$192/Sq Ft
Est. Value
About This Home
This home is located at 6730 Cicero Rd, Hicksville, OH 43526 and is currently estimated at $303,649, approximately $191 per square foot. 6730 Cicero Rd is a home located in Defiance County with nearby schools including Hicksville Elementary School and Hicksville High School.
Ownership History
Date
Name
Owned For
Owner Type
Purchase Details
Closed on
Jul 19, 2011
Sold by
Secretary Of Vetrerans Affairs
Bought by
Livengood Kyle and Livengood Tabatha
Current Estimated Value
Home Financials for this Owner
Home Financials are based on the most recent Mortgage that was taken out on this home.
Original Mortgage
$143,273
Outstanding Balance
$97,914
Interest Rate
4.37%
Mortgage Type
FHA
Estimated Equity
$205,735
Purchase Details
Closed on
Nov 1, 2010
Sold by
Mendez Richard L and Mendez Richard Lee
Bought by
Secretary Of Hud
Purchase Details
Closed on
Aug 5, 2008
Sold by
Hochstetler Loy G and Hochstetler Joanna M
Bought by
Mendez Richard L and Mendez Richard Lee
Home Financials for this Owner
Home Financials are based on the most recent Mortgage that was taken out on this home.
Original Mortgage
$177,000
Interest Rate
6.42%
Mortgage Type
VA
Purchase Details
Closed on
Jul 25, 2000
Bought by
Livengood Kyle and Livengood Tabatha B
Create a Home Valuation Report for This Property
The Home Valuation Report is an in-depth analysis detailing your home's value as well as a comparison with similar homes in the area
Home Values in the Area
Average Home Value in this Area
Purchase History
| Date | Buyer | Sale Price | Title Company |
|---|---|---|---|
| Livengood Kyle | -- | -- | |
| Secretary Of Hud | $90,000 | -- | |
| Mendez Richard L | $132,750 | -- | |
| Livengood Kyle | -- | -- |
Source: Public Records
Mortgage History
| Date | Status | Borrower | Loan Amount |
|---|---|---|---|
| Open | Livengood Kyle | $143,273 | |
| Previous Owner | Mendez Richard L | $177,000 |
Source: Public Records
Tax History Compared to Growth
Tax History
| Year | Tax Paid | Tax Assessment Tax Assessment Total Assessment is a certain percentage of the fair market value that is determined by local assessors to be the total taxable value of land and additions on the property. | Land | Improvement |
|---|---|---|---|---|
| 2024 | $2,996 | $85,170 | $6,530 | $78,640 |
| 2023 | $2,996 | $85,170 | $6,530 | $78,640 |
| 2022 | $2,640 | $64,020 | $5,980 | $58,040 |
| 2021 | $2,640 | $64,020 | $5,980 | $58,040 |
| 2020 | $2,675 | $64,020 | $5,980 | $58,040 |
| 2019 | $2,343 | $57,300 | $5,890 | $51,410 |
| 2018 | $2,144 | $51,980 | $5,890 | $46,090 |
| 2017 | $2,139 | $51,982 | $5,890 | $46,092 |
| 2016 | $1,781 | $43,190 | $5,687 | $37,503 |
| 2015 | $919 | $43,190 | $5,687 | $37,503 |
| 2014 | $919 | $43,190 | $5,687 | $37,503 |
| 2013 | $919 | $43,190 | $5,687 | $37,503 |
| 2012 | $919 | $43,191 | $5,688 | $37,503 |
Source: Public Records
Map
Nearby Homes
- 7580 Hicksville Edgerton Rd
- 909 E High St
- 0 Wonderly Rd
- 7155 Casebeer Miller Rd
- 505 E Smith St
- 424 E High St
- 516 Ogen St
- 307 Wendell Ave
- 203 S Main St
- 507 N Main St
- 105 Clearview Dr
- 127 Dixon Ave
- 217 W Edgerton St
- 202 Spencerville St
- 307 Spencerville St
- 9819 Ohio 249
- 319 W High St
- 338 Chicago Ave
- 1974 State Route 49
- 11309 State Route 49
- 6696 Cicero Rd
- 6664 Cicero Rd
- 6816 Cicero Rd
- 6773 Cicero Rd Unit 6885
- 6850 Cicero Rd
- 6629 Cicero Rd
- 6885 Cicero Rd
- 6906 Cicero Rd
- 0 Huber Unit 5047622
- 6544 Cicero Rd
- 5943 Huber Rd
- 6429 Cicero Rd
- 7040 Cicero Rd
- 5745 Huber Rd
- 6318 Cicero Rd
- 7210 Cicero Rd
- 5618 Huber Rd
- 6209 Cicero Rd
- 5469 Huber Rd
- 7276 Cicero Rd