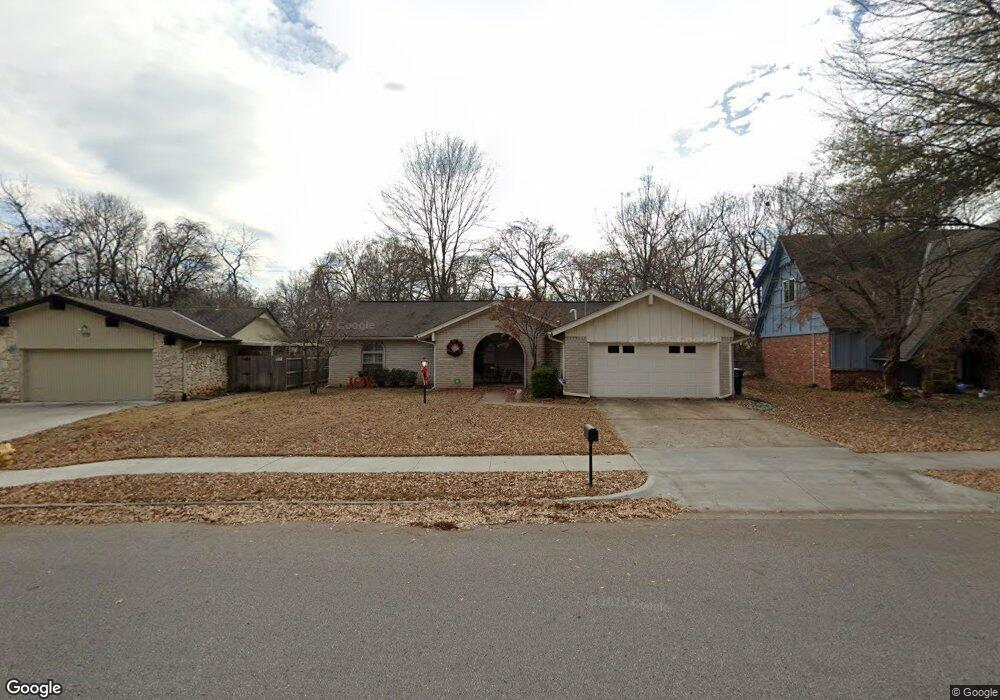
6730 E 76th St Tulsa, OK 74133
Sheridan Valley NeighborhoodEstimated Value: $260,926 - $286,000
4
Beds
2
Baths
1,980
Sq Ft
$135/Sq Ft
Est. Value
About This Home
This home is located at 6730 E 76th St, Tulsa, OK 74133 and is currently estimated at $267,982, approximately $135 per square foot. 6730 E 76th St is a home located in Tulsa County with nearby schools including Darnaby Elementary School, Union 6th-7th Grade Center, and Union 8th Grade Center.
Ownership History
Date
Name
Owned For
Owner Type
Purchase Details
Closed on
Apr 21, 2011
Sold by
Bennett Leslie and Bennett Michael
Bought by
Bennett Leslie and Bennett Michael
Current Estimated Value
Home Financials for this Owner
Home Financials are based on the most recent Mortgage that was taken out on this home.
Original Mortgage
$99,990
Outstanding Balance
$69,075
Interest Rate
5.06%
Mortgage Type
FHA
Estimated Equity
$198,907
Purchase Details
Closed on
Mar 21, 2011
Sold by
Ford Laurel Ann Cherry and Powers Jon
Bought by
Bennet Leslie and Bennet Michael
Home Financials for this Owner
Home Financials are based on the most recent Mortgage that was taken out on this home.
Original Mortgage
$99,990
Outstanding Balance
$69,075
Interest Rate
5.06%
Mortgage Type
FHA
Estimated Equity
$198,907
Purchase Details
Closed on
Nov 14, 2001
Sold by
Helms Warren G and Helms Joann C
Bought by
Helms Warren G and Helms Joann C
Purchase Details
Closed on
Jul 27, 2001
Sold by
Kirk Cliff C and Kirk Elaine L
Bought by
Helms Warren G and Helms Joann C
Purchase Details
Closed on
Jun 1, 1997
Purchase Details
Closed on
May 26, 1997
Sold by
Beynet Pierre A and Beynet Patricia A
Bought by
Kirk Cliff C and Kirk Elaine L
Create a Home Valuation Report for This Property
The Home Valuation Report is an in-depth analysis detailing your home's value as well as a comparison with similar homes in the area
Home Values in the Area
Average Home Value in this Area
Purchase History
| Date | Buyer | Sale Price | Title Company |
|---|---|---|---|
| Bennett Leslie | -- | Tulsa Abstract & Title Co | |
| Bennet Leslie | $123,500 | Tulsa & Abstact Title Co | |
| Helms Warren G | -- | -- | |
| Helms Warren G | $123,500 | -- | |
| -- | $91,500 | -- | |
| Kirk Cliff C | $91,500 | Guaranty Abstract Company |
Source: Public Records
Mortgage History
| Date | Status | Borrower | Loan Amount |
|---|---|---|---|
| Open | Bennet Leslie | $99,990 |
Source: Public Records
Tax History
| Year | Tax Paid | Tax Assessment Tax Assessment Total Assessment is a certain percentage of the fair market value that is determined by local assessors to be the total taxable value of land and additions on the property. | Land | Improvement |
|---|---|---|---|---|
| 2025 | $2,506 | $18,698 | $2,160 | $16,538 |
| 2024 | $2,152 | $17,807 | $1,970 | $15,837 |
| 2023 | $2,152 | $16,959 | $2,105 | $14,854 |
| 2022 | $2,153 | $16,152 | $2,888 | $13,264 |
| 2021 | $2,032 | $15,383 | $2,750 | $12,633 |
| 2020 | $2,004 | $15,383 | $2,750 | $12,633 |
| 2019 | $2,108 | $15,383 | $2,750 | $12,633 |
| 2018 | $2,149 | $15,650 | $3,026 | $12,624 |
| 2017 | $2,043 | $14,905 | $2,882 | $12,023 |
| 2016 | $2,001 | $14,905 | $2,882 | $12,023 |
| 2015 | $2,005 | $14,905 | $2,882 | $12,023 |
| 2014 | $1,986 | $14,905 | $2,882 | $12,023 |
Source: Public Records
Map
Nearby Homes
- 7605 S Sheridan Rd
- 6211 E 77th St
- 6505 E 78th St
- 6212 E 77th Place
- 6919 E 74th St
- 7732 S 69th East Place
- 6115 E 77th St
- 7318 S 69th East Place
- 7714 S Kingston Ave
- 7505 S 70th East Ave
- 7731 S Joplin Ave
- 7805 S 70th East Ave
- 7915 S 69th East Ave
- 6985 E 72nd St
- 7725 S Granite Ave
- 7127 E 80th St
- 6932 S 73rd East Ave
- 7606 E 77th St
- 7951 S Hudson Place
- 6777 S 71st East Ave
- 6736 E 76th St
- 6726 E 76th St
- 6740 E 76th St
- 6731 E 76th St
- 6725 E 76th St
- 6737 E 76th St
- 6746 E 76th St
- 6714 E 76th St
- 6717 E 76th St
- 6745 E 76th St
- 6802 E 76th St
- 6708 E 76th St
- 7512 S 68th East Ave
- 6711 E 76th St
- 6710 E 75th Ct
- 6706 E 75th Ct
- 7603 S Sheridan Rd
- 6702 E 76th St
- 7519 S 68th East Ave
- 7531 S 67th East Ave
Your Personal Tour Guide
Ask me questions while you tour the home.