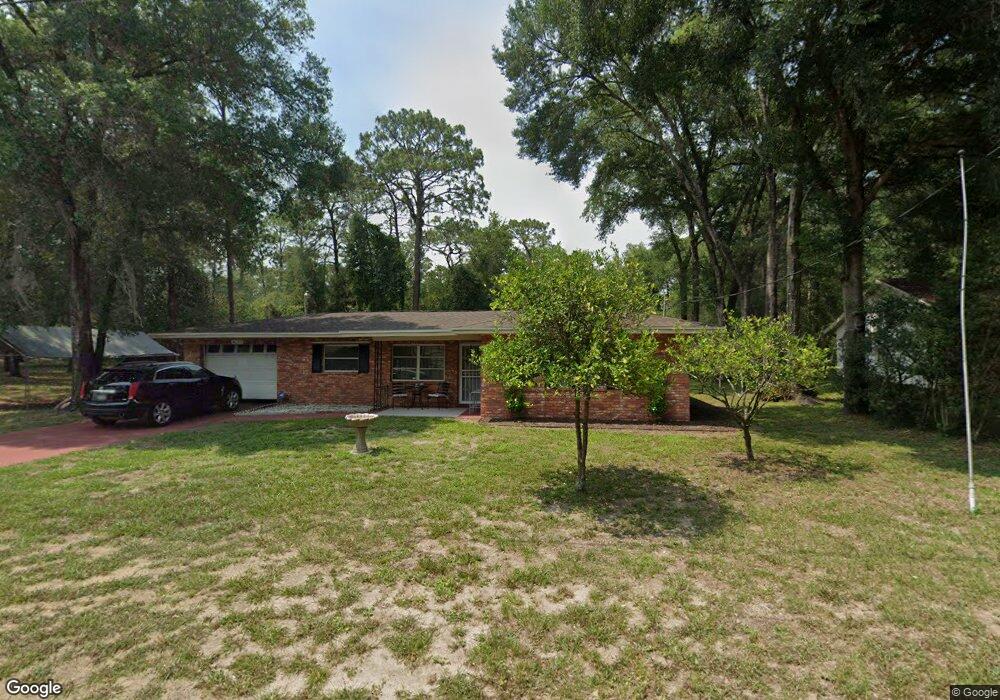
6733 E Gurley St Unit 17 Inverness, FL 34452
Estimated Value: $233,997 - $260,000
2
Beds
2
Baths
1,126
Sq Ft
$219/Sq Ft
Est. Value
About This Home
This home is located at 6733 E Gurley St Unit 17, Inverness, FL 34452 and is currently estimated at $246,749, approximately $219 per square foot. 6733 E Gurley St Unit 17 is a home located in Citrus County with nearby schools including Pleasant Grove Elementary School, Inverness Middle School, and Citrus High School.
Ownership History
Date
Name
Owned For
Owner Type
Purchase Details
Closed on
Nov 6, 2024
Sold by
Rhyne Mitzi
Bought by
Pearson Ashlei
Current Estimated Value
Home Financials for this Owner
Home Financials are based on the most recent Mortgage that was taken out on this home.
Original Mortgage
$248,417
Outstanding Balance
$245,944
Interest Rate
6.12%
Mortgage Type
FHA
Estimated Equity
$805
Purchase Details
Closed on
Aug 26, 2022
Sold by
Cordero Rodolfo A and Cordero Kathy M
Bought by
Rhyne Mitzi
Purchase Details
Closed on
May 5, 2022
Sold by
Tatrow and Jacqueline
Bought by
Cordero Rodolfo A and Cordero Kathy M
Purchase Details
Closed on
May 2, 2001
Sold by
Tatrow Jacqueline C and Tatrow Duane
Bought by
Tatrow Duane and Tatrow Jacqueline
Purchase Details
Closed on
Apr 20, 2001
Sold by
Keith Cook
Bought by
Tatrow Duane and Tatrow Jacqueline
Purchase Details
Closed on
Jan 29, 2001
Sold by
Tenz Agnes M
Bought by
Thornton Geneva and Tatrow Jacqueline C
Create a Home Valuation Report for This Property
The Home Valuation Report is an in-depth analysis detailing your home's value as well as a comparison with similar homes in the area
Home Values in the Area
Average Home Value in this Area
Purchase History
| Date | Buyer | Sale Price | Title Company |
|---|---|---|---|
| Pearson Ashlei | $253,000 | American Title Services | |
| Pearson Ashlei | $253,000 | American Title Services | |
| Rhyne Mitzi | $240,000 | -- | |
| Cordero Rodolfo A | $140,000 | American Title Services | |
| Tatrow Duane | -- | Crystal River Title | |
| Tatrow Duane | $2,600 | Crystal River Title | |
| Thornton Geneva | $40,000 | Crystal River Title |
Source: Public Records
Mortgage History
| Date | Status | Borrower | Loan Amount |
|---|---|---|---|
| Open | Pearson Ashlei | $248,417 | |
| Closed | Pearson Ashlei | $248,417 |
Source: Public Records
Tax History Compared to Growth
Tax History
| Year | Tax Paid | Tax Assessment Tax Assessment Total Assessment is a certain percentage of the fair market value that is determined by local assessors to be the total taxable value of land and additions on the property. | Land | Improvement |
|---|---|---|---|---|
| 2024 | $2,400 | $153,175 | $12,480 | $140,695 |
| 2023 | $2,400 | $149,259 | $13,120 | $136,139 |
| 2022 | $1,498 | $113,804 | $6,000 | $107,804 |
| 2021 | $1,293 | $89,440 | $5,280 | $84,160 |
| 2020 | $1,152 | $81,900 | $4,980 | $76,920 |
| 2019 | $1,062 | $72,682 | $4,570 | $68,112 |
| 2018 | $937 | $60,730 | $5,220 | $55,510 |
| 2017 | $870 | $54,151 | $4,260 | $49,891 |
| 2016 | $837 | $50,686 | $4,290 | $46,396 |
| 2015 | $742 | $40,620 | $3,270 | $37,350 |
| 2014 | $816 | $43,710 | $6,351 | $37,359 |
Source: Public Records
Map
Nearby Homes
- 6659 E Grayson St
- 6700 E Haynes Ln
- 6660 E Haynes Ln
- 6361 E Gurley St
- 3963 S Placid Ave
- 6375 E Glover St
- 6325 E Glover St
- 6601 E Gentry St
- 6717 E Gentry St
- 6633 E Hayden Ln
- 3569 S Belgrave Dr
- 3533 S Belgrave Dr
- 3529 S Belgrave Dr
- 6535 E Gentry St
- QUAIL RIDGE Plan at The Collection at Inverness
- PRESCOTT Plan at The Collection at Inverness
- BRASELTON Plan at The Collection at Inverness
- ALTON Plan at The Collection at Inverness
- 3988 S Highlands Ave
- 6691 E Harold Ln
- 6746 E Gurley St
- 6751 E Gurley St
- 6709 E Gurley St
- 6732 E Gurley St
- 6716 E Gurley St
- 6758 E Gurley St
- 6670 E Gurley St
- 6731 E Glover St
- 6690 E Gurley St
- 6747 E Holly St
- 6717 E Holly St
- 3783 S Ventura Ave
- 3801 S Ventura Ave
- 6745 E Glover St
- 3767 S Ventura Ave
- 3838 S Ventura Ave
- 6701 E Holly St
- 6701 & 6717 E Holly St
- 3809 S Ventura Ave
- 6670 E Glover St