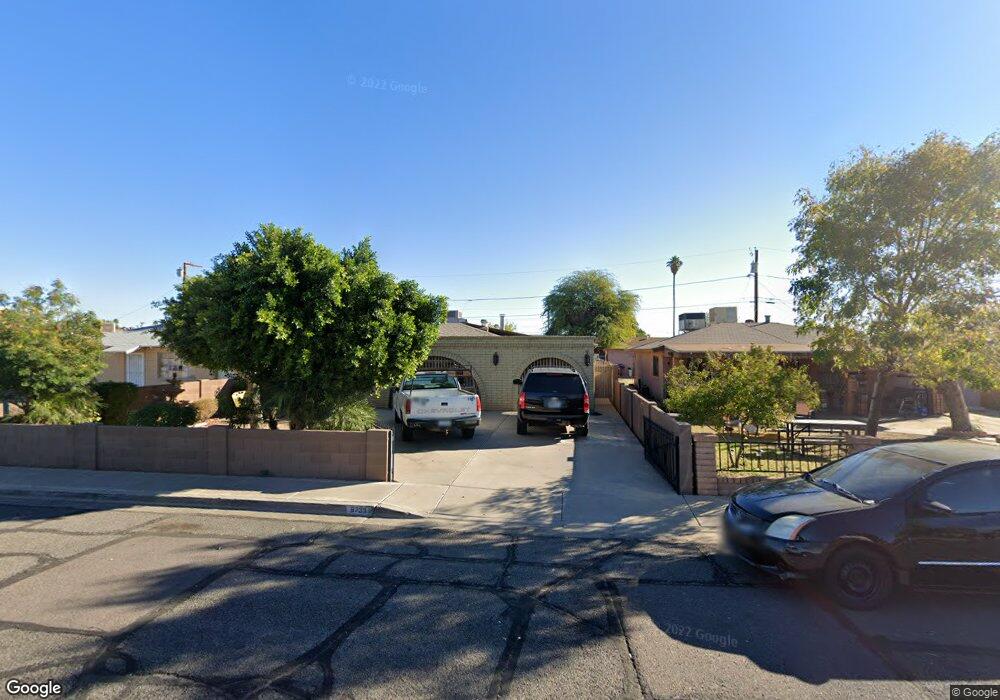
6733 N 53rd Dr Glendale, AZ 85301
Estimated Value: $310,000 - $387,000
--
Bed
2
Baths
2,472
Sq Ft
$141/Sq Ft
Est. Value
About This Home
This home is located at 6733 N 53rd Dr, Glendale, AZ 85301 and is currently estimated at $349,203, approximately $141 per square foot. 6733 N 53rd Dr is a home located in Maricopa County with nearby schools including Glenn F Burton School, Apollo High School, and Academy of Math and Science - Glendale.
Ownership History
Date
Name
Owned For
Owner Type
Purchase Details
Closed on
Jun 10, 2022
Sold by
Soza Bejarano Miguel and Soza Maria Rosa
Bought by
Hernandez Laura Lisa and Hernandez Noah
Current Estimated Value
Home Financials for this Owner
Home Financials are based on the most recent Mortgage that was taken out on this home.
Original Mortgage
$252,000
Outstanding Balance
$239,695
Interest Rate
5.23%
Mortgage Type
New Conventional
Estimated Equity
$109,508
Purchase Details
Closed on
Nov 12, 2020
Sold by
Hernandez Isaac E
Bought by
Bejarano Miguel Soza and Bejarano Rosa Maria
Home Financials for this Owner
Home Financials are based on the most recent Mortgage that was taken out on this home.
Original Mortgage
$216,015
Interest Rate
2.8%
Mortgage Type
FHA
Purchase Details
Closed on
Mar 5, 2017
Sold by
Campos Alice M
Bought by
Hernandez Isaac E
Create a Home Valuation Report for This Property
The Home Valuation Report is an in-depth analysis detailing your home's value as well as a comparison with similar homes in the area
Home Values in the Area
Average Home Value in this Area
Purchase History
| Date | Buyer | Sale Price | Title Company |
|---|---|---|---|
| Hernandez Laura Lisa | $315,000 | Pioneer Title | |
| Bejarano Miguel Soza | $220,000 | Title Alliance Of Phoenix Ag | |
| Hernandez Isaac E | -- | None Available |
Source: Public Records
Mortgage History
| Date | Status | Borrower | Loan Amount |
|---|---|---|---|
| Open | Hernandez Laura Lisa | $252,000 | |
| Previous Owner | Bejarano Miguel Soza | $216,015 |
Source: Public Records
Tax History Compared to Growth
Tax History
| Year | Tax Paid | Tax Assessment Tax Assessment Total Assessment is a certain percentage of the fair market value that is determined by local assessors to be the total taxable value of land and additions on the property. | Land | Improvement |
|---|---|---|---|---|
| 2025 | $1,195 | $9,705 | -- | -- |
| 2024 | $1,041 | $9,242 | -- | -- |
| 2023 | $1,041 | $24,750 | $4,950 | $19,800 |
| 2022 | $1,036 | $15,260 | $3,050 | $12,210 |
| 2021 | $1,031 | $13,260 | $2,650 | $10,610 |
| 2020 | $1,044 | $11,430 | $2,280 | $9,150 |
| 2019 | $1,033 | $10,170 | $2,030 | $8,140 |
| 2018 | $431 | $9,320 | $1,860 | $7,460 |
| 2017 | $0 | $8,030 | $1,600 | $6,430 |
| 2016 | $0 | $7,710 | $1,540 | $6,170 |
| 2015 | -- | $5,130 | $1,020 | $4,110 |
Source: Public Records
Map
Nearby Homes
- 6706 N 54th Dr
- 6541 N 54th Ave
- 5239 W Maryland Ave
- 6713 N 56th Ave
- 5601 W Glendale Ave
- 4938 W Mclellan Rd
- 4944 W Sierra Vista Dr
- 5416 W Myrtle Ave
- 5420 W Myrtle Ave
- 5443 W Northview Ave
- 7300 N 51st Ave Unit F177
- 7300 N 51st Ave Unit B238
- 7300 N 51st Ave Unit H118
- 7300 N 51st Ave Unit G124
- 7300 N 51st Ave Unit F93
- 7300 N 51st Ave Unit F99
- 7300 N 51st Ave Unit C50
- 7300 N 51st Ave Unit E78
- 7300 N 51st Ave Unit E191
- 4813 W Krall St
- 6737 N 53rd Dr
- 6729 N 53rd Dr
- 6729 N 53rd Dr
- 6741 N 53rd Dr
- 6725 N 53rd Dr
- 6736 N 53rd Ave
- 6732 N 53rd Ave
- 6721 N 53rd Dr
- 6745 N 53rd Dr
- 6742 N 53rd Ave
- 6728 N 53rd Ave
- 6730 N 53rd Dr
- 6746 N 53rd Ave
- 6717 N 53rd Dr
- 6722 N 53rd Ave
- 6738 N 53rd Dr
- 6726 N 53rd Dr
- 6734 N 53rd Dr
- 6734 N 53rd Dr
- 6713 N 53rd Dr