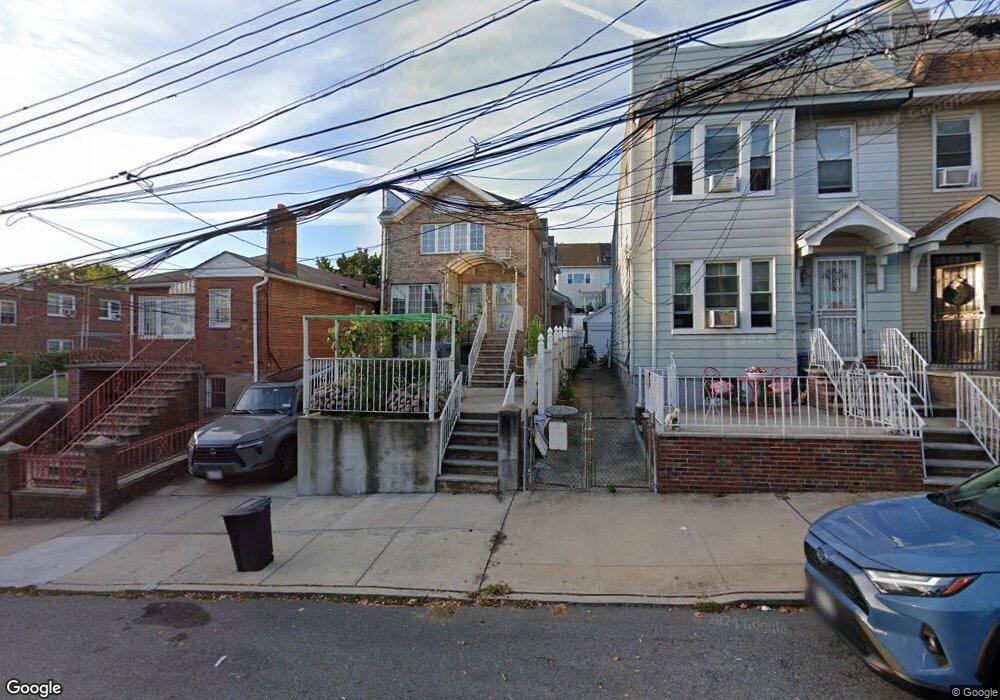
6734 52nd Rd Maspeth, NY 11378
Maspeth NeighborhoodEstimated Value: $1,207,981 - $1,414,000
Studio
--
Bath
2,709
Sq Ft
$479/Sq Ft
Est. Value
About This Home
This home is located at 6734 52nd Rd, Maspeth, NY 11378 and is currently estimated at $1,296,745, approximately $478 per square foot. 6734 52nd Rd is a home located in Queens County with nearby schools including P.S. 229 Emanuel Kaplan, IS 73 - The Frank Sansivieri School, and Grover Cleveland High School.
Ownership History
Date
Name
Owned For
Owner Type
Purchase Details
Closed on
Nov 28, 2020
Sold by
Wu Feng and Dizhang David Di
Bought by
Zhang Joyce Yun and Zhang Rui
Current Estimated Value
Purchase Details
Closed on
Dec 21, 2007
Sold by
Woo Lesbia
Bought by
Wu Feng and Zhang Di
Home Financials for this Owner
Home Financials are based on the most recent Mortgage that was taken out on this home.
Original Mortgage
$100,000
Outstanding Balance
$62,911
Interest Rate
6.27%
Estimated Equity
$1,233,834
Purchase Details
Closed on
Jul 25, 2002
Sold by
Walsh Eugene and Walsh Catherine
Bought by
Healy Anthony J
Home Financials for this Owner
Home Financials are based on the most recent Mortgage that was taken out on this home.
Original Mortgage
$279,000
Interest Rate
6.27%
Create a Home Valuation Report for This Property
The Home Valuation Report is an in-depth analysis detailing your home's value as well as a comparison with similar homes in the area
Home Values in the Area
Average Home Value in this Area
Purchase History
| Date | Buyer | Sale Price | Title Company |
|---|---|---|---|
| Zhang Joyce Yun | -- | -- | |
| Zhang Joyce Yun | -- | -- | |
| Wu Feng | $835,000 | -- | |
| Wu Feng | $835,000 | -- | |
| Healy Anthony J | -- | -- | |
| Healy Anthony J | -- | -- |
Source: Public Records
Mortgage History
| Date | Status | Borrower | Loan Amount |
|---|---|---|---|
| Open | Wu Feng | $100,000 | |
| Closed | Wu Feng | $100,000 | |
| Open | Wu Feng | $533,000 | |
| Closed | Wu Feng | $533,000 | |
| Previous Owner | Healy Anthony J | $279,000 |
Source: Public Records
Tax History
| Year | Tax Paid | Tax Assessment Tax Assessment Total Assessment is a certain percentage of the fair market value that is determined by local assessors to be the total taxable value of land and additions on the property. | Land | Improvement |
|---|---|---|---|---|
| 2025 | $11,047 | $56,609 | $9,707 | $46,902 |
| 2024 | $11,059 | $56,401 | $9,082 | $47,319 |
| 2023 | $10,406 | $53,209 | $7,234 | $45,975 |
| 2022 | $9,734 | $78,660 | $12,840 | $65,820 |
| 2021 | $9,758 | $69,960 | $12,840 | $57,120 |
| 2020 | $9,689 | $68,160 | $12,840 | $55,320 |
| 2019 | $9,539 | $66,960 | $12,840 | $54,120 |
| 2018 | $8,741 | $44,341 | $10,116 | $34,225 |
| 2017 | $8,228 | $41,832 | $10,070 | $31,762 |
| 2016 | $7,649 | $41,832 | $10,070 | $31,762 |
| 2015 | $4,540 | $39,312 | $11,888 | $27,424 |
| 2014 | $4,540 | $39,168 | $12,666 | $26,502 |
Source: Public Records
Map
Nearby Homes
- 6731 52nd Rd
- 52-14 69th St
- 71-10 52nd Ave
- 52-62 68th St
- 51-29 69th Place
- 52-61 66th St
- 70-03 52nd Ave
- 5221 65th Place Unit 6N
- 52-15 65th Place Unit 3A
- 52-21 65th Place Unit 6P
- 50-46 69th Place
- 52-24 65th Place Unit 3K
- 53-36 67th St
- 5307 65th Place
- 52-60 65th Place Unit 5E
- 53-24 66th St
- 71-22 Calamus Ave
- 53-36 66th St
- 53-54 66th St
- 52-79 72nd St
- 6736 52nd Rd
- 6732 52nd Rd
- 6732 52nd Rd Unit 2nd Fl
- 6730 52nd Rd
- 6738 52nd Rd
- 6728 52nd Rd
- 67-28 52nd Rd Unit 1 Flr
- 6726 52nd Rd
- 6817 52nd Dr
- 6815 52nd Dr
- 68-15 52nd Dr
- 5232 69th St
- 6813 52nd Dr
- 5230 69th St
- 5230 69th St Unit 2nd Fl
- 52-30 69th St Unit 2nd Fl
- 6821 52nd Dr
- 52-34 69th St
- 5228 69th St
- 5234 69th St
Your Personal Tour Guide
Ask me questions while you tour the home.