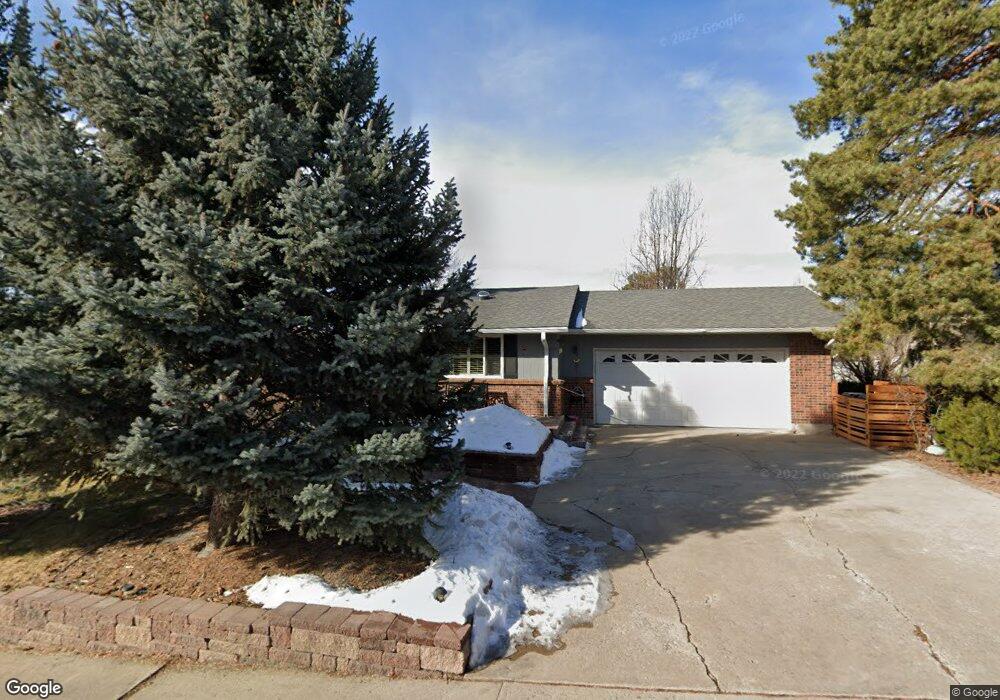
6735 Garrison St Arvada, CO 80004
Scenic Heights NeighborhoodEstimated Value: $577,000 - $708,000
3
Beds
5
Baths
1,247
Sq Ft
$527/Sq Ft
Est. Value
About This Home
This home is located at 6735 Garrison St, Arvada, CO 80004 and is currently estimated at $656,854, approximately $526 per square foot. 6735 Garrison St is a home located in Jefferson County with nearby schools including Secrest Elementary School, North Arvada Middle School, and Arvada High School.
Ownership History
Date
Name
Owned For
Owner Type
Purchase Details
Closed on
Dec 30, 2015
Sold by
Halm Lawrence D and Schimer Judy D
Bought by
Halm & Schimer Trust
Current Estimated Value
Purchase Details
Closed on
Dec 20, 2011
Sold by
Halm Lawrence D
Bought by
Halm Lawrence D and Schimer Judy D
Purchase Details
Closed on
Jun 25, 2011
Sold by
Halm Lawrence D
Bought by
Halm Lawrence D and Schimer Judy D
Purchase Details
Closed on
Aug 11, 2000
Sold by
Gallo Lou Ann C and Wade Lou Ann C
Bought by
Halm Lawrence D
Purchase Details
Closed on
Sep 7, 1999
Sold by
Halm Lawrence D and Grove Debra C
Bought by
Halm Lawrence Dudley
Purchase Details
Closed on
Oct 8, 1997
Sold by
Gallo Albert L and Gallo Eloise E
Bought by
Halm Lawrence D and Grove Debra C
Home Financials for this Owner
Home Financials are based on the most recent Mortgage that was taken out on this home.
Original Mortgage
$125,600
Interest Rate
7.59%
Create a Home Valuation Report for This Property
The Home Valuation Report is an in-depth analysis detailing your home's value as well as a comparison with similar homes in the area
Home Values in the Area
Average Home Value in this Area
Purchase History
| Date | Buyer | Sale Price | Title Company |
|---|---|---|---|
| Halm & Schimer Trust | -- | None Available | |
| Halm Lawrence D | -- | None Available | |
| Halm Lawrence D | -- | None Available | |
| Halm Lawrence D | -- | -- | |
| Halm Lawrence Dudley | -- | -- | |
| Halm Lawrence D | $157,000 | First American Heritage Titl |
Source: Public Records
Mortgage History
| Date | Status | Borrower | Loan Amount |
|---|---|---|---|
| Previous Owner | Halm Lawrence D | $125,600 |
Source: Public Records
Tax History
| Year | Tax Paid | Tax Assessment Tax Assessment Total Assessment is a certain percentage of the fair market value that is determined by local assessors to be the total taxable value of land and additions on the property. | Land | Improvement |
|---|---|---|---|---|
| 2024 | $3,894 | $46,844 | $24,745 | $22,099 |
| 2023 | $3,894 | $46,844 | $24,745 | $22,099 |
| 2022 | $2,970 | $37,275 | $18,054 | $19,221 |
| 2021 | $3,019 | $38,348 | $18,574 | $19,774 |
| 2020 | $3,238 | $33,555 | $14,807 | $18,748 |
| 2019 | $3,194 | $33,555 | $14,807 | $18,748 |
| 2018 | $3,020 | $30,839 | $11,720 | $19,119 |
| 2017 | $2,764 | $30,839 | $11,720 | $19,119 |
| 2016 | $2,319 | $24,374 | $7,411 | $16,963 |
| 2015 | $2,238 | $24,374 | $7,411 | $16,963 |
| 2014 | $2,238 | $22,106 | $7,794 | $14,312 |
Source: Public Records
Map
Nearby Homes
- 6745 Garrison St
- 9303 W 66th Place
- 9369 W 67th Ave
- 6823 Garland St
- 6965 Independence St
- 8885 W 64th Place
- 6966 Dudley Dr
- 8644 W 66th Cir
- 8612 W 69th Place
- 6984 Dover Way
- 9015 W 63rd Ave
- 9909 W 70th Ave
- 8601 W 64th Place
- 9142 Oberon Rd
- 6240 Everett Ct Unit B
- 6648 Lewis St
- 8320 W 66th Ave
- 8401 W 64th Place
- 6371 Brooks Dr
- 8940 Cole Dr
- 6732 Garland St
- 6742 Garland St
- 6712 Garland St
- 6710 Garrison St
- 6752 Garland St
- 6730 Garrison St
- 6700 Garrison St
- 6675 Garrison St
- 6765 Garrison St
- 9238 W 67th Ave
- 6762 Garland St
- 9248 W 67th Ave
- 6733 Garland St
- 6770 Garrison St
- 9194 W 67th Ave
- 6743 Garland St
- 6713 Garland St
- 9151 W 67th Ave
- 6795 Garrison St
- 9268 W 67th Ave
Your Personal Tour Guide
Ask me questions while you tour the home.