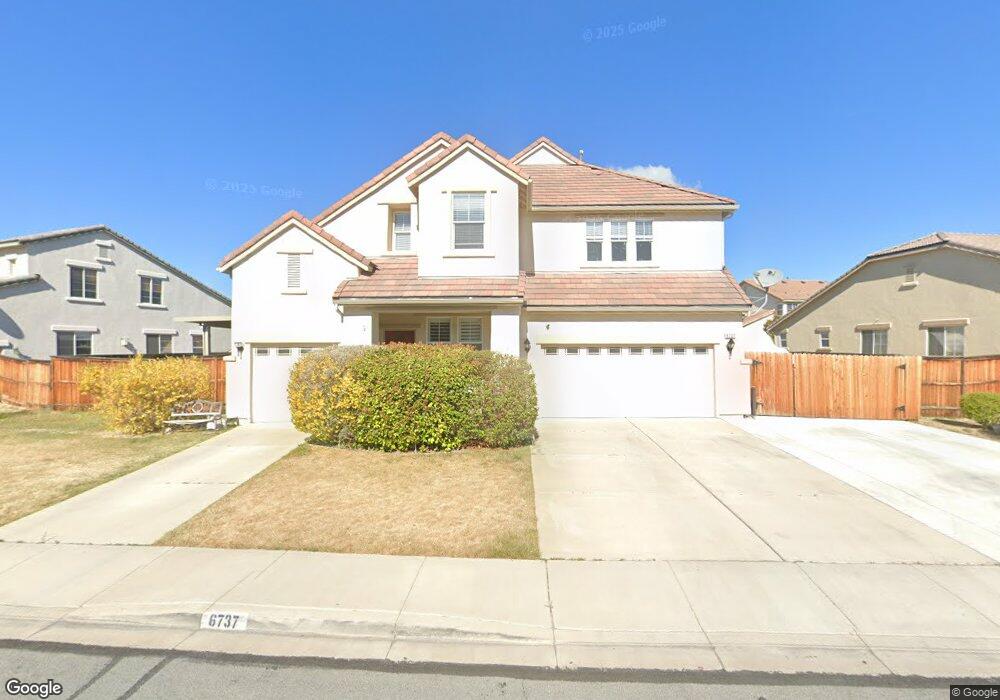
6737 Jaquenetta Dr Sparks, NV 89436
Pioneer Meadows NeighborhoodEstimated Value: $720,743 - $790,000
5
Beds
4
Baths
3,735
Sq Ft
$203/Sq Ft
Est. Value
About This Home
This home is located at 6737 Jaquenetta Dr, Sparks, NV 89436 and is currently estimated at $757,686, approximately $202 per square foot. 6737 Jaquenetta Dr is a home located in Washoe County with nearby schools including Bohach Elementary School, Sky Ranch Middle School, and Spanish Springs High School.
Ownership History
Date
Name
Owned For
Owner Type
Purchase Details
Closed on
Aug 10, 2016
Sold by
Lacross Phillip and Lacross Kahra
Bought by
Lacross Phillip and Lacross Kahra
Current Estimated Value
Home Financials for this Owner
Home Financials are based on the most recent Mortgage that was taken out on this home.
Original Mortgage
$369,700
Outstanding Balance
$291,886
Interest Rate
3.41%
Mortgage Type
VA
Estimated Equity
$465,800
Purchase Details
Closed on
Oct 19, 2006
Sold by
Lennar Reno Llc
Bought by
Lacross Philip and Lacross Kahra
Home Financials for this Owner
Home Financials are based on the most recent Mortgage that was taken out on this home.
Original Mortgage
$403,900
Interest Rate
6.75%
Mortgage Type
Unknown
Purchase Details
Closed on
Jan 4, 2006
Sold by
Mw Housing Partners Iii Lp
Bought by
Lennar Reno Llc
Create a Home Valuation Report for This Property
The Home Valuation Report is an in-depth analysis detailing your home's value as well as a comparison with similar homes in the area
Home Values in the Area
Average Home Value in this Area
Purchase History
| Date | Buyer | Sale Price | Title Company |
|---|---|---|---|
| Lacross Phillip | -- | Advantage Title Llc | |
| Lacross Philip | $505,000 | North American Title Co | |
| Lennar Reno Llc | $1,375,500 | North American Title Co |
Source: Public Records
Mortgage History
| Date | Status | Borrower | Loan Amount |
|---|---|---|---|
| Open | Lacross Phillip | $369,700 | |
| Closed | Lacross Philip | $403,900 |
Source: Public Records
Tax History Compared to Growth
Tax History
| Year | Tax Paid | Tax Assessment Tax Assessment Total Assessment is a certain percentage of the fair market value that is determined by local assessors to be the total taxable value of land and additions on the property. | Land | Improvement |
|---|---|---|---|---|
| 2026 | $3,159 | $183,527 | $36,855 | $146,672 |
| 2025 | $4,105 | $182,985 | $36,540 | $146,445 |
| 2024 | $3,866 | $181,034 | $33,635 | $147,399 |
| 2023 | $3,866 | $197,583 | $37,030 | $160,553 |
| 2022 | $3,753 | $164,886 | $31,535 | $133,351 |
| 2021 | $3,647 | $158,223 | $25,830 | $132,393 |
| 2020 | $3,643 | $158,367 | $25,935 | $132,432 |
| 2019 | $3,435 | $153,347 | $24,780 | $128,567 |
| 2018 | $3,333 | $143,571 | $18,270 | $125,301 |
| 2017 | $3,240 | $142,543 | $17,325 | $125,218 |
| 2016 | $3,157 | $142,518 | $15,785 | $126,733 |
| 2015 | $3,246 | $141,206 | $14,875 | $126,331 |
| 2014 | $3,060 | $103,354 | $12,495 | $90,859 |
| 2013 | -- | $85,414 | $10,780 | $74,634 |
Source: Public Records
Map
Nearby Homes
- 2073 Marcus Way
- 2073 Marcus Way Unit Homesite 2
- 6658 Abbotswood Dr
- 2069 Marcus Way Unit Homesite 1
- 2064 Marcus Way Unit Homesite 11
- 2230 Long Island Ct
- 2045 Elk Falls Way Unit Homesite 26
- 2037 Elk Falls Way Unit Homesite 24
- 2037 Elk Falls Way
- 2041 Elk Falls Way Unit Homesite 25
- 7090 Lemur Landing Way
- 2025 Elk Falls Way
- 2617 Bridgetown Loop
- 7181 Lemur Landing Way Unit Homesite 529
- 7181 Lemur Landing Way
- 7194 Lemur Landing Way Unit Homesite 521
- 2012 Maradona Dr
- 2691 Sutter Butte Ct
- 4234 White Feather Way
- 2386 Newberry Way
- 6727 Jaquenetta Dr
- 6740 Bambey Dr
- 6748 Bambey Dr
- 6763 Jaquenetta Dr
- 6760 Bambey Dr
- 6740 Jaquenetta Dr
- 6734 Jaquenetta Dr
- 2430 Hibernica Ln
- 6374 Jaquenetta Dr
- 6748 Jaquenetta Dr
- 2409 Hibernica Ln
- 6775 Jaquenetta Dr
- 2417 Hibernica Ln
- 6760 Jaquenetta Dr
- 2401 Hibernica Ln
- 2438 Hibernica Ln
- 2425 Hibernica Ln
- 6737 Kiskadee Dr
- 6725 Kiskadee Dr
- 6774 Jaquenetta Dr