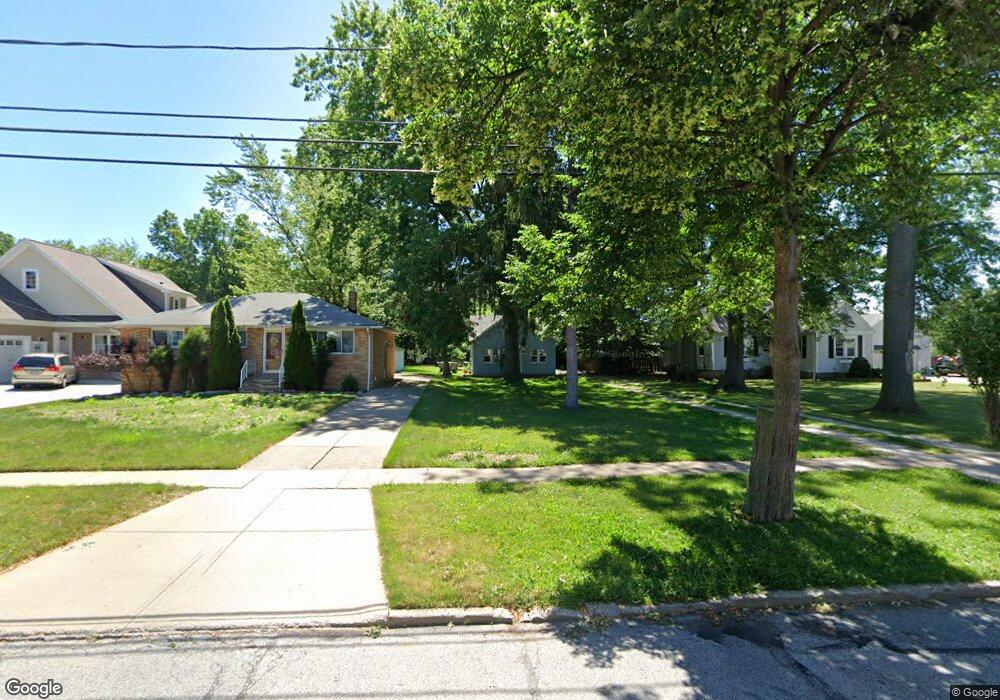
674 Bryn Mawr Ave Wickliffe, OH 44092
Estimated Value: $172,000 - $218,000
4
Beds
1
Bath
1,080
Sq Ft
$181/Sq Ft
Est. Value
About This Home
This home is located at 674 Bryn Mawr Ave, Wickliffe, OH 44092 and is currently estimated at $195,637, approximately $181 per square foot. 674 Bryn Mawr Ave is a home located in Lake County with nearby schools including Wickliffe Elementary School, Wickliffe Middle School, and Wickliffe High School.
Ownership History
Date
Name
Owned For
Owner Type
Purchase Details
Closed on
Apr 14, 2004
Sold by
Ward Scan T and Ward Kristi L
Bought by
Merkun Philip M and Merkun Laura L
Current Estimated Value
Home Financials for this Owner
Home Financials are based on the most recent Mortgage that was taken out on this home.
Original Mortgage
$106,000
Outstanding Balance
$48,745
Interest Rate
5.66%
Mortgage Type
Purchase Money Mortgage
Estimated Equity
$146,892
Purchase Details
Closed on
Nov 1, 1997
Sold by
Molter Mark A
Bought by
Ward Sean T and Ward Kristi L
Home Financials for this Owner
Home Financials are based on the most recent Mortgage that was taken out on this home.
Original Mortgage
$70,500
Interest Rate
7.42%
Purchase Details
Closed on
Nov 29, 1996
Sold by
Reid Maryann T
Bought by
Molter Mark A
Home Financials for this Owner
Home Financials are based on the most recent Mortgage that was taken out on this home.
Original Mortgage
$51,400
Interest Rate
7.94%
Mortgage Type
New Conventional
Purchase Details
Closed on
Jan 1, 1990
Bought by
Reid Maryann T
Create a Home Valuation Report for This Property
The Home Valuation Report is an in-depth analysis detailing your home's value as well as a comparison with similar homes in the area
Home Values in the Area
Average Home Value in this Area
Purchase History
| Date | Buyer | Sale Price | Title Company |
|---|---|---|---|
| Merkun Philip M | $106,000 | -- | |
| Ward Sean T | $83,000 | Enterprise Title Agency Inc | |
| Molter Mark A | $53,000 | -- | |
| Reid Maryann T | -- | -- |
Source: Public Records
Mortgage History
| Date | Status | Borrower | Loan Amount |
|---|---|---|---|
| Open | Merkun Philip M | $106,000 | |
| Closed | Ward Sean T | $70,500 | |
| Previous Owner | Molter Mark A | $51,400 |
Source: Public Records
Tax History
| Year | Tax Paid | Tax Assessment Tax Assessment Total Assessment is a certain percentage of the fair market value that is determined by local assessors to be the total taxable value of land and additions on the property. | Land | Improvement |
|---|---|---|---|---|
| 2025 | -- | $55,430 | $14,640 | $40,790 |
| 2024 | -- | $55,430 | $14,640 | $40,790 |
| 2023 | $4,513 | $36,700 | $12,470 | $24,230 |
| 2022 | $2,633 | $36,700 | $12,470 | $24,230 |
| 2021 | $2,644 | $36,700 | $12,470 | $24,230 |
| 2020 | $2,550 | $30,080 | $10,220 | $19,860 |
| 2019 | $2,549 | $30,080 | $10,220 | $19,860 |
| 2018 | $2,207 | $35,350 | $17,440 | $17,910 |
| 2017 | $2,488 | $35,350 | $17,440 | $17,910 |
| 2016 | $2,476 | $35,350 | $17,440 | $17,910 |
| 2015 | $2,433 | $35,350 | $17,440 | $17,910 |
| 2014 | $2,143 | $35,350 | $17,440 | $17,910 |
| 2013 | $2,142 | $35,350 | $17,440 | $17,910 |
Source: Public Records
Map
Nearby Homes
- 295 E 276th St
- 625 Lloyd Rd
- 427 E 275th St
- 29310 Grand Blvd
- 350 E 273rd St
- 29616 Grand Blvd
- 866 Elmwood Ave
- 27175 Cameron Ave
- 29690 Franklin Ave
- 28507 Lakeshore Blvd
- 257 E 270th St
- 141 Eastbrook Dr
- 28525 Lakeshore Blvd
- 375 Beechwood Dr
- 411 E 270th St
- 28759 Forest Rd
- 440 E 271st St
- 940 Talmadge Ave
- 29566 Shaker Dr
- 28949 Beechwood Dr
- 680 Bryn Mawr Ave
- 670 Bryn Mawr Ave
- 684 Bryn Mawr Ave
- 688 Bryn Mawr Ave
- 361 E 280th St
- 365 E 280th St
- SL Bryn Mawr
- 29370 Parkwood Dr
- 29356 Parkwood Dr
- 355 E 280th St
- 369 E 280th St
- 692 Bryn Mawr Ave
- 29386 Parkwood Dr
- 643 N Elmwood Ave
- 351 E 280th St
- 373 E 280th St
- 347 E 280th St
- 347 E 280th St Unit E
- 696 Bryn Mawr Ave
- 649 N Elmwood Ave
Your Personal Tour Guide
Ask me questions while you tour the home.