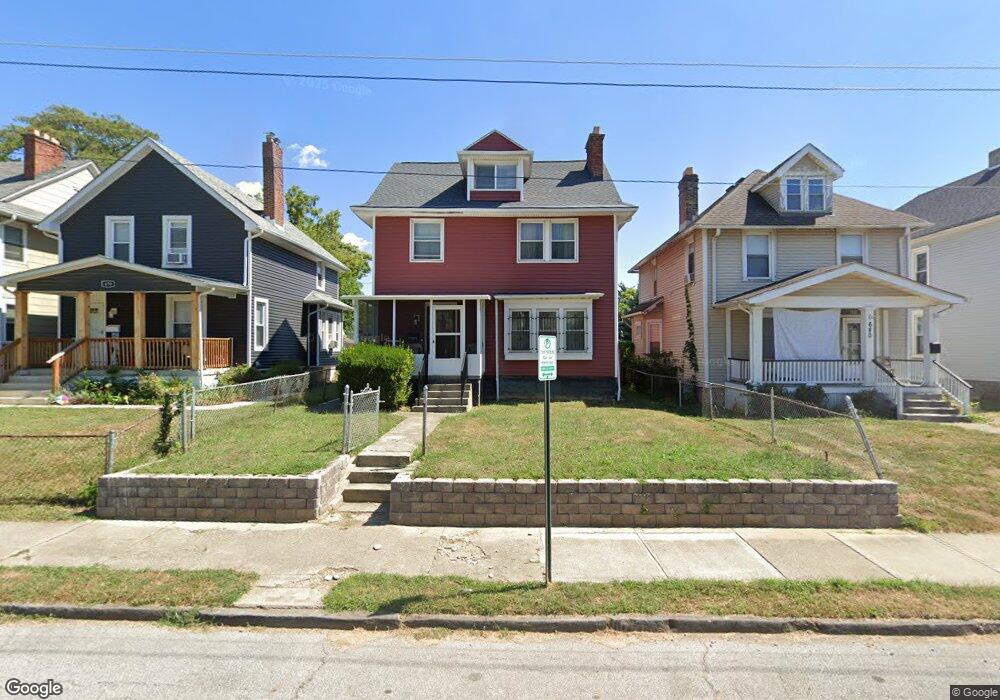
674 Carpenter St Columbus, OH 43205
Livingston Park NeighborhoodEstimated Value: $164,000 - $262,000
3
Beds
1
Bath
1,470
Sq Ft
$155/Sq Ft
Est. Value
About This Home
This home is located at 674 Carpenter St, Columbus, OH 43205 and is currently estimated at $228,042, approximately $155 per square foot. 674 Carpenter St is a home located in Franklin County with nearby schools including Livingston Elementary School, South High School, and South Columbus Preparatory Academy.
Ownership History
Date
Name
Owned For
Owner Type
Purchase Details
Closed on
Jun 14, 1960
Bought by
Neal Fred E and Neal Thelma L
Current Estimated Value
Create a Home Valuation Report for This Property
The Home Valuation Report is an in-depth analysis detailing your home's value as well as a comparison with similar homes in the area
Home Values in the Area
Average Home Value in this Area
Purchase History
| Date | Buyer | Sale Price | Title Company |
|---|---|---|---|
| Neal Fred E | -- | -- |
Source: Public Records
Tax History
| Year | Tax Paid | Tax Assessment Tax Assessment Total Assessment is a certain percentage of the fair market value that is determined by local assessors to be the total taxable value of land and additions on the property. | Land | Improvement |
|---|---|---|---|---|
| 2025 | $3,478 | $87,300 | $28,390 | $58,910 |
| 2024 | $3,478 | $87,300 | $28,390 | $58,910 |
| 2023 | $3,462 | $87,290 | $28,385 | $58,905 |
| 2022 | $1,055 | $29,090 | $4,970 | $24,120 |
| 2021 | $1,057 | $29,090 | $4,970 | $24,120 |
| 2020 | $1,058 | $29,090 | $4,970 | $24,120 |
| 2019 | $948 | $24,370 | $4,170 | $20,200 |
| 2018 | $680 | $24,370 | $4,170 | $20,200 |
| 2017 | $947 | $24,370 | $4,170 | $20,200 |
| 2016 | $457 | $15,650 | $3,400 | $12,250 |
| 2015 | $415 | $15,650 | $3,400 | $12,250 |
| 2014 | $416 | $15,650 | $3,400 | $12,250 |
| 2013 | $229 | $16,450 | $3,570 | $12,880 |
Source: Public Records
Map
Nearby Homes
- 904 E Livingston Ave
- 711 S 22nd St
- 903 E Livingston Ave
- 662 S 22nd St Unit 664
- 741 Heyl Ave
- 800 Carpenter St
- 674 S Ohio Ave
- 795 S Ohio Ave
- 605 S Ohio Ave
- 786 S Ohio Ave
- 1036 Newton St Unit 38
- 631-633 S Champion Ave
- 730 S Champion Ave
- 700 S Champion Ave Unit 702
- 867 S 22nd St
- 870 Gilbert St
- 0 Carpenter St
- 863 Carpenter St
- 647 Oakwood Ave
- 676 Wager St
- 670 Carpenter St
- 680 Carpenter St
- 666 Carpenter St
- 684 Carpenter St Unit 686
- 684-686 Carpenter St
- 660 Carpenter St
- 690 Carpenter St
- 694 Carpenter St
- 677 Gilbert St
- 685 Gilbert St Unit 687
- 691 Gilbert St Unit 693
- 681 Gilbert St
- 650 Carpenter St Unit 652
- 669 Gilbert St
- 673 Gilbert St
- 697 Gilbert St
- 663 Gilbert St
- 701 Gilbert St
- 671 Carpenter St
- 677 Carpenter St
Your Personal Tour Guide
Ask me questions while you tour the home.