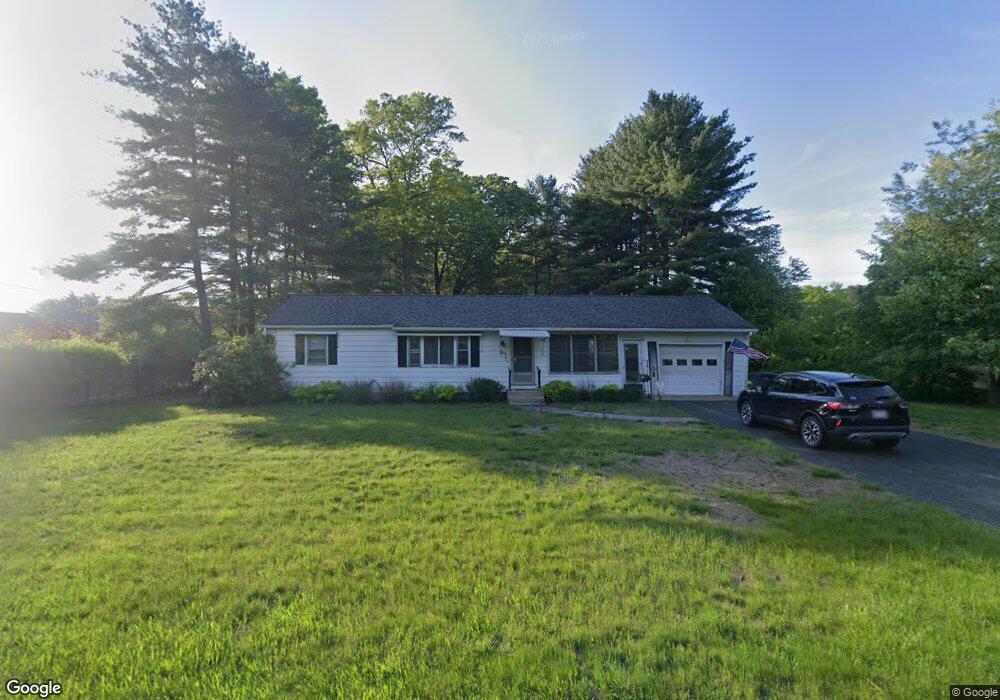
674 Holyoke Rd Westfield, MA 01085
Estimated Value: $294,000 - $379,000
2
Beds
1
Bath
864
Sq Ft
$377/Sq Ft
Est. Value
About This Home
This home is located at 674 Holyoke Rd, Westfield, MA 01085 and is currently estimated at $326,015, approximately $377 per square foot. 674 Holyoke Rd is a home located in Hampden County with nearby schools including Westfield High School, Westfield Christian Academy, and White Oak School.
Ownership History
Date
Name
Owned For
Owner Type
Purchase Details
Closed on
Jun 9, 2008
Sold by
Mactavish Amanda M
Bought by
Mactavish Robert M
Current Estimated Value
Purchase Details
Closed on
Oct 17, 2006
Sold by
Wright Mabel B
Bought by
Mactavish Amanda M and Mactavish Robert M
Home Financials for this Owner
Home Financials are based on the most recent Mortgage that was taken out on this home.
Original Mortgage
$135,200
Interest Rate
6.47%
Mortgage Type
Purchase Money Mortgage
Create a Home Valuation Report for This Property
The Home Valuation Report is an in-depth analysis detailing your home's value as well as a comparison with similar homes in the area
Home Values in the Area
Average Home Value in this Area
Purchase History
| Date | Buyer | Sale Price | Title Company |
|---|---|---|---|
| Mactavish Robert M | -- | -- | |
| Mactavish Amanda M | $169,000 | -- |
Source: Public Records
Mortgage History
| Date | Status | Borrower | Loan Amount |
|---|---|---|---|
| Previous Owner | Mactavish Amanda M | $135,200 | |
| Previous Owner | Mactavish Amanda M | $33,800 |
Source: Public Records
Tax History Compared to Growth
Tax History
| Year | Tax Paid | Tax Assessment Tax Assessment Total Assessment is a certain percentage of the fair market value that is determined by local assessors to be the total taxable value of land and additions on the property. | Land | Improvement |
|---|---|---|---|---|
| 2025 | $4,118 | $271,300 | $102,000 | $169,300 |
| 2024 | $4,186 | $262,100 | $92,800 | $169,300 |
| 2023 | $4,041 | $236,600 | $88,300 | $148,300 |
| 2022 | $3,868 | $209,200 | $78,700 | $130,500 |
| 2021 | $3,742 | $198,200 | $74,200 | $124,000 |
| 2020 | $3,629 | $188,500 | $74,200 | $114,300 |
| 2019 | $3,548 | $180,400 | $70,900 | $109,500 |
| 2018 | $3,493 | $180,400 | $70,900 | $109,500 |
| 2017 | $3,426 | $176,400 | $71,800 | $104,600 |
| 2016 | $3,429 | $176,400 | $71,800 | $104,600 |
| 2015 | $3,270 | $176,400 | $71,800 | $104,600 |
| 2014 | $2,444 | $176,400 | $71,800 | $104,600 |
Source: Public Records
Map
Nearby Homes